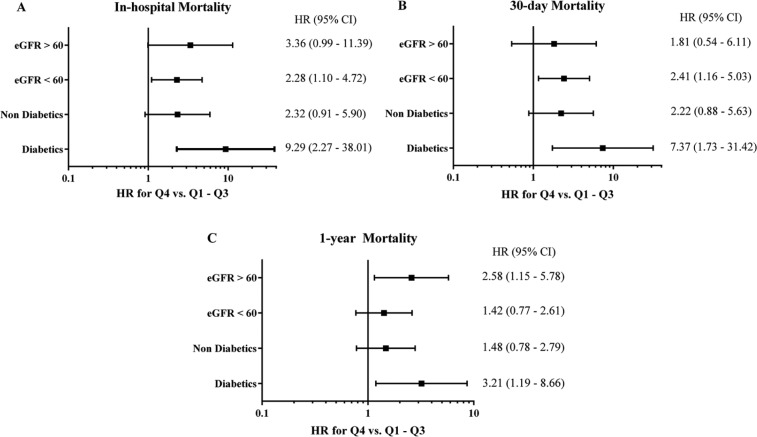
Figure 5.
Adjusted hazard ratios for subgroup analysis of in-hospital (A), 30-day (B), and 1-year (C) rates of all-cause death, stratified by diabetes and estimated glomerular filtration rates.
Adjusted hazard ratios (HR) and confidence intervals calculated by the Cockcroft–Gault formula. Rates of all-cause death are shown for the comparison between admission osmolality in quartile 4 vs. quartiles 1–3. Diabetics, n=228; nondiabetics, 744 eGFR <60 ml/min, 246 eGFR ≥60 ml/min, 664. eGFR, estimated glomerular filtration rate.

