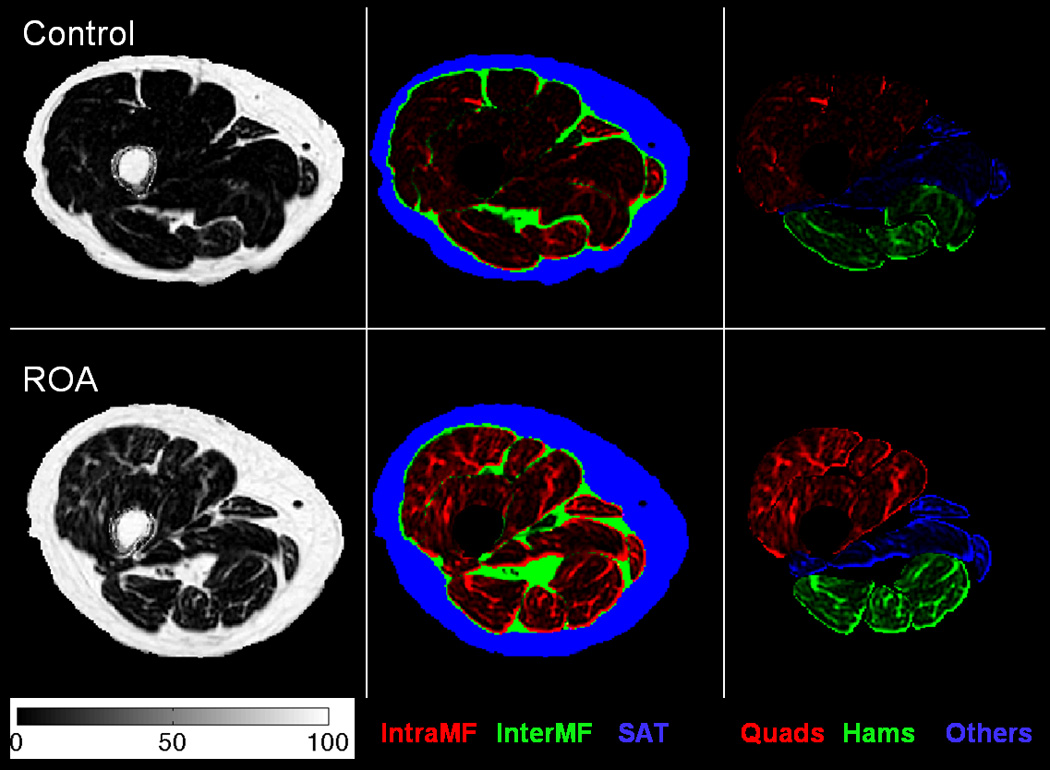
FIGURE 1.

Comparison of fat distribution and fat content at a representative slice between a control subject (first row) and an ROA subject (second row) with the same age, gender and similar total muscle Lean ACSA. The first column shows the fat fraction maps (colorbar units in %). The second column shows color-coded fat fraction maps highlighting the intramuscular fat fraction (red), intermuscular fat fraction (green) and SAT (blue) regions. The third columns shows color-coded fat fraction maps highlighting the quadriceps (red), hamstrings (green) and other muscle (blue) regions. The color-coded maps were weighted by the fat fraction map values.
