
Figure 7.
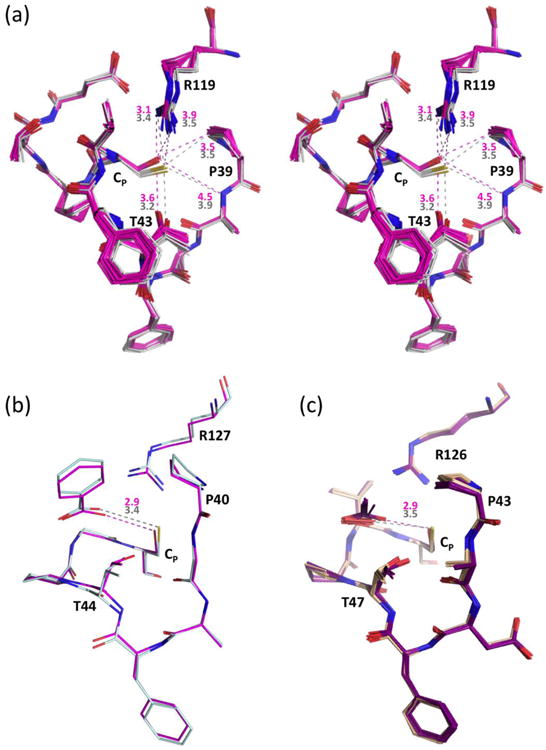
Active site changes due to CP→Ser mutations. (a) Stereo diagram of 20 chains of C46S (pink) overlaid onto the 4 chains of wild type StAhpC (solid white), with representative distances given in Å based on C46S Chain K (pink) and wild type Chain A (grey). Estimation of coordinate uncertainty by SFCHECK68 for both of these models are in the range of 0.2-0.3 Å. (b) Active site overlay of wild type HsPrxV (light blue, PDB code 1hd2) and its CP→Ser mutant (pink, PDB code 1urm) with color-coded distances to the bound benzoate indicated, which were chosen for comparison based on having resolution better than 2.0 Å, clear density for the ligands, and adoption of the same space group with similar unit cells. For 12 chains of wild type HsPrxV with benzoate, acetate, or DTT ligands (PDB codes 1hd2, 3mng, 1h4o, 1oc3, 2vl2, and 2vl3) the average Cys Sγ…ligand distance is 3.46 Å (c) Active site overlay of 10 chains from wild type ApTpx (light pink, peroxide-bound; PDB code 3a2v) and 10 chains from its CP→Ser mutant (purple, acetate bound; PDB code 3a2x) with the color-coded average distances indicated.