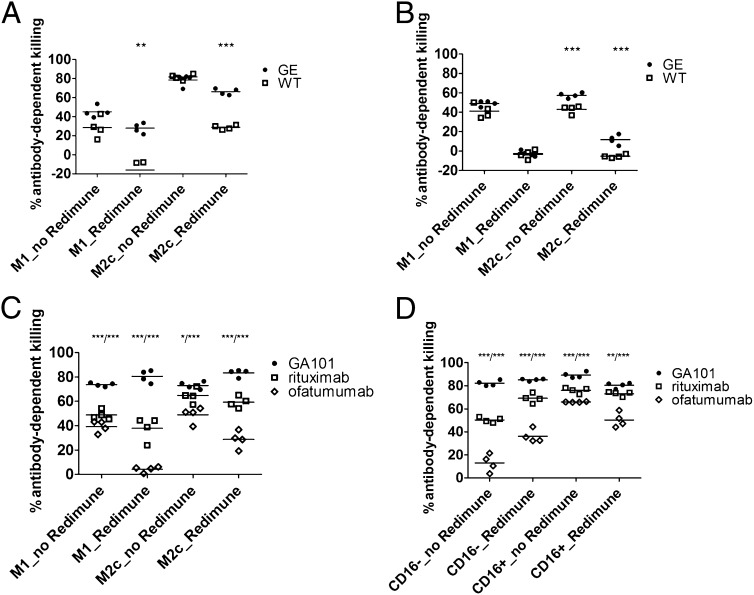
FIGURE 6.
Assessment of the overall macrophage activity. (A) The overall macrophage activity was assessed in a 48-h coculture assay of MKN45 tumor cells with human M1 or M2c macrophages (E:T ratio, 3:1) in the presence of GA201 or cetuximab and Redimune (10 mg/ml). (B) The overall macrophage activity assessed in a 48-h coculture assay of KPL-4 tumor cells with human M1 or M2c macrophages (E:T ratio, 4:1) in the presence of trastuzumab GE and WT Abs and Redimune (10 mg/ml). Quadruplicates of two representative experiments out of a total of four with different Abs and tumor target cells are shown. Statistical analysis, unpaired t test: *p < 0.05, **p < 0.01, ***p < 0.001. The overall macrophage (C) or monocyte (D) activity in combination with direct Ab effects was assessed in a 24-h coculture assay of Raji tumor cells with human isolated CD16+ or CD16− monocytes or monocyte-derived M1 or M2c macrophages (E:T ratio, 3:1) in the presence of GA101, rituximab and ofatumumab, and Redimune (10 mg/ml). Quadruplicates of two representative experiments out of a total of six (three with monocytes and three with macrophages as effectors) from different donors are shown. Statistical analysis, unpaired t test: *p < 0.05, **p < 0.01, ***p < 0.001, comparison of GA101 to rituximab/comparison GA101 to ofatumumab indicated on top of the graphs.

