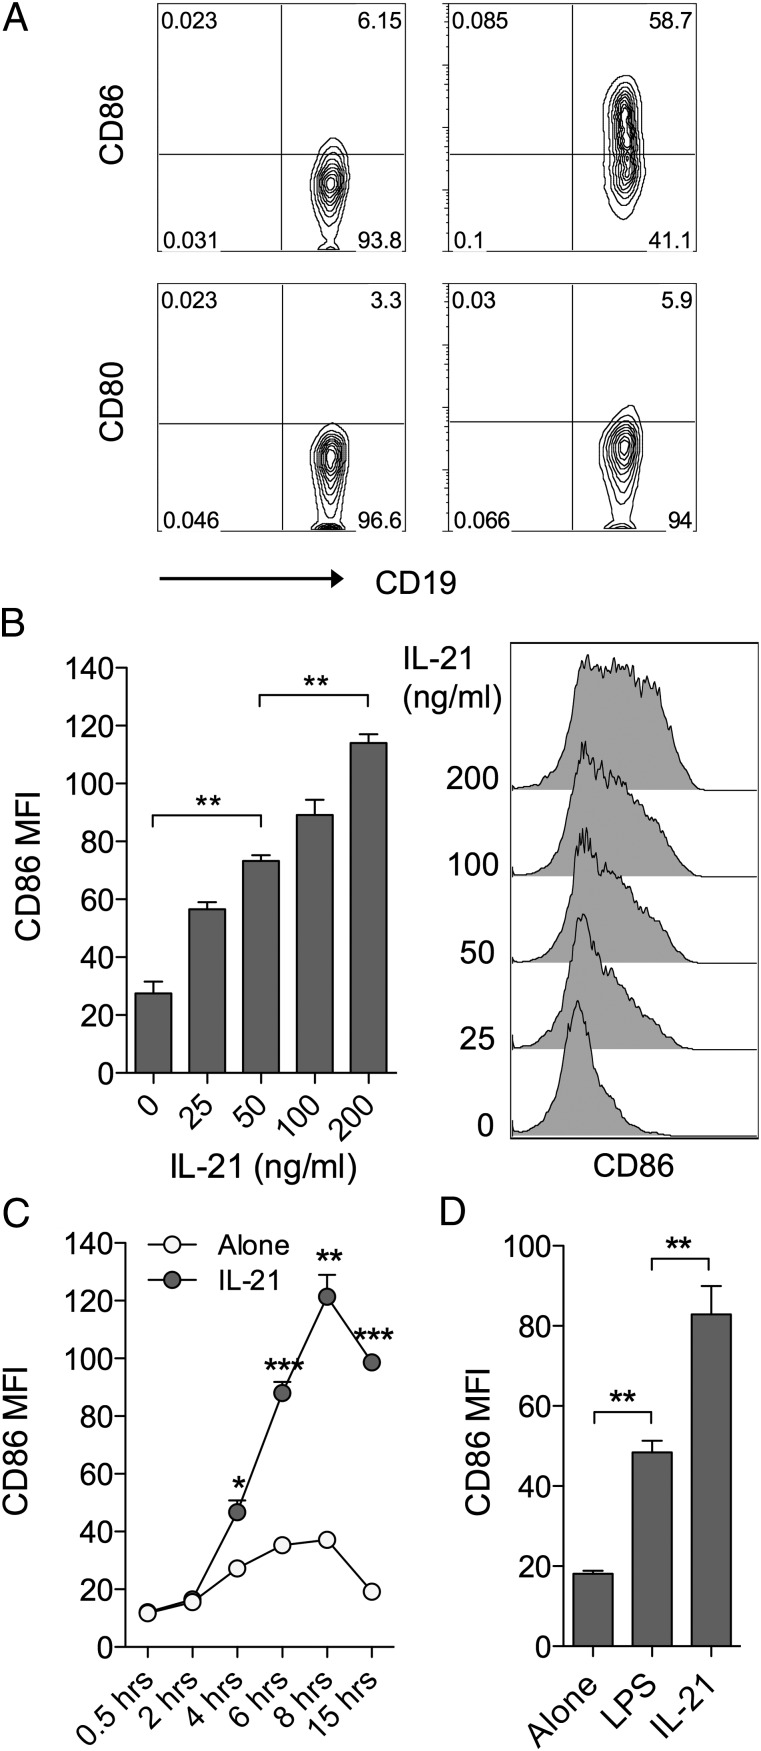
FIGURE 1.
IL-21 upregulates CD86 expression on B cells. (A) BALB/c splenocytes (1 × 10⁵) were cultured for 16 h alone or in the presence of 200 ng/ml IL-21. Plots show representative CD80 and CD86 expression for gated CD19+ B cells. (B) BALB/c splenocytes (1 × 10⁵) were cultured for 16 h alone or in the presence of the indicated doses of IL-21. Histograms show CD86 expression for gated CD19+ B cells and graph shows collated CD86 mean fluorescence intensity (MFI) data. (C) BALB/c splenocytes (1 × 10⁵) were cultured alone or in the presence of 200 ng/ml IL-21 and harvested at the indicated time points. Graph shows collated CD86 MFI data for gated CD19+ B cells. (D) BALB/c splenocytes (1 × 10⁵) were cultured for 16 h alone or in the presence of either 200 ng/ml IL-21 or 1 μg/ml LPS. Graph shows collated CD86 MFI data for gated CD19+ B cells. Data are representative of at least three independent experiments. *p < 0.05, **p < 0.01, ***p < 0.001.

