Figure 1.
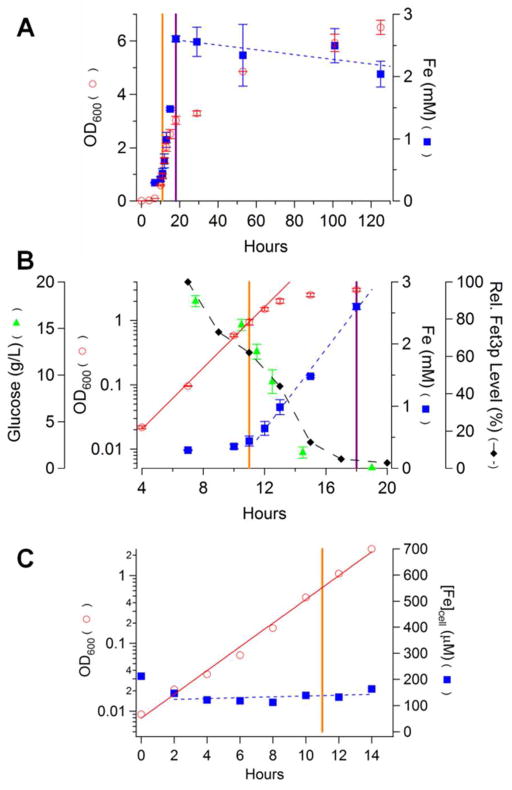
Chronological profile of nutrient, growth and Fe-associated parameters for cells grown in batch culture on YPAD for 5 days. A, full plots; B, zoom of 4 – 20 hr; C, 0 – 14 hr for a follow-up experiment. Data include OD600 (circles), cellular Fe concentration (squares), glucose concentration (triangles) and Fet3p expression (diamonds). Orange vertical lines demarcate exponential and transitionary modes; purple lines demarcate transitionary and slow-growing modes. Plotted OD600 and iron(glucose) concentrations in A and B were the average of two(three) independent experiments. Bars indicate standard deviation.

