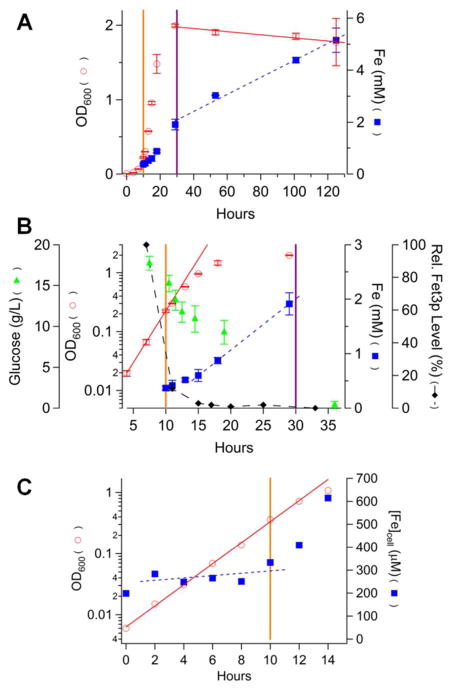
Figure 2.
Chronological profile of nutrient, growth and Fe-associated parameters for cells grown in batch culture on MM for 5 days. A, full plots; B, zoom of 5 – 35 hr; C, 0 – 14 hr for a follow-up experiment. Data symbols and lines are the same as in Figure 1. Reported OD600 and iron(glucose) concentrations in A and B were the average of two(three) independent experiments. Bars indicate standard deviation.

