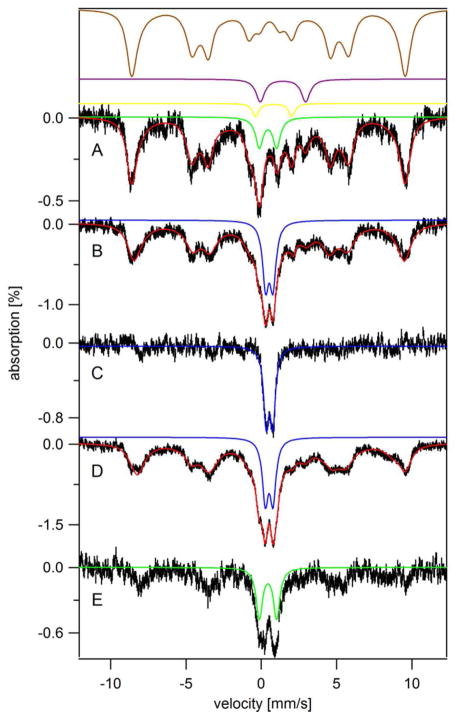
Figure 3.
5 K 0.04 T Mösbauer spectra of whole yeast cells grown on YPAD and harvested at various time points. A, early transitionary phase (OD 2.1); B, late transitionary phase (OD 3.2); C, B-minus-A difference spectrum; D, post-diauxic growth phase (OD 8.0); E, D-minus-B difference spectrum. Red lines simulate collectively the spectral features associated with HS FeIII, NHHS FeII, HS FeII heme, CD, and FeIII nanoparticles. Brown, purple, yellow, green and blue lines are simulations of HS FeIII, NHHS FeII, HS FeII heme, the central doublet, and FeIII nanoparticles, respectively. The field was applied parallel to γ-rays.

