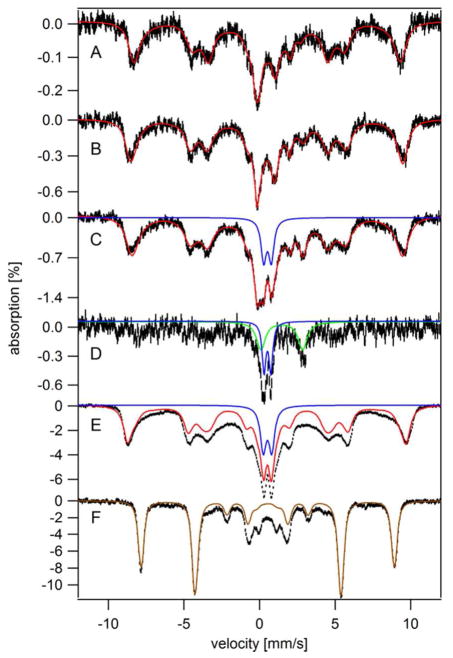
Figure 4.
Mössbauer spectra of whole yeast cells grown on MM and harvested at various time points. For A – E, the temperature was 5 K and a 40 mT field was applied parallel to γ-rays. For F, the temperature was 4.2 K and a 6 T field was applied perpendicular to the γ-rays. A, early exponential phase (OD 0.2); B, exponential phase (OD 1.2); C, transitionary phase (OD 1.8); D, C-minus-B difference spectrum (the spectral intensity of B was doubled and then subtracted from C) E, stationary phase (OD 1.8, 5-day-grown); F, an equivalent sample of E (OD 1.7, 5-day-grown). Red lines are composite simulations that include contributions from HS FeIII, NHHS FeII, HS FeII heme, CD, and FeIII nanoparticles. Blue and green lines simulate contributions from FeIII nanoparticles and HS FeII, respectively. The brown line simulates the HS FeIII species using S = 5/2, D = 0.15 cm−1, E/D = 0.21, A0/gN·β N = −233 kG, δ = 0.55 mm/s, ΔEQ = 0.42 mm/s, and η = 1.3.

