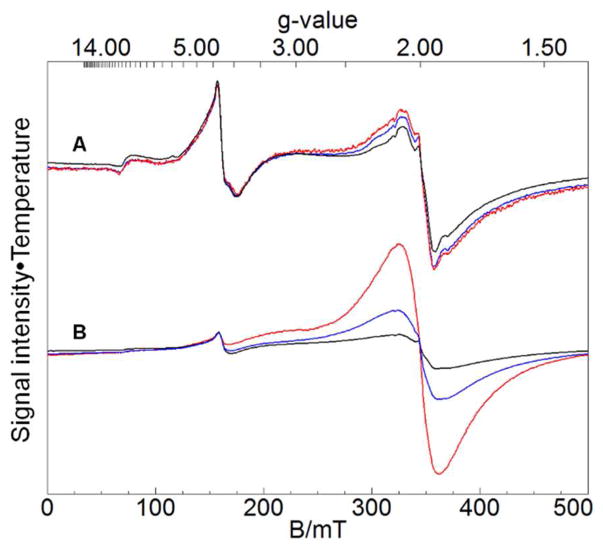
Figure 5.
X-band EPR spectra of 5-day-grown cells. A, grown on MM with 40 μM Fe; B, grown on MM with 400 μM Fe. Black, 10 K; blue, 30 K; red, 80 K. Spectra were recorded at 0.05 mW microwave power, 9.64 GHz frequency and 10 Gauss modulation amplitude, and then have been adjusted vertically so that the g = 4.3 resonances are aligned. Spectral intensities in A and B were multiplied by absolute temperature while those in A were additionally multiplied by 5 for presentation purposes.

