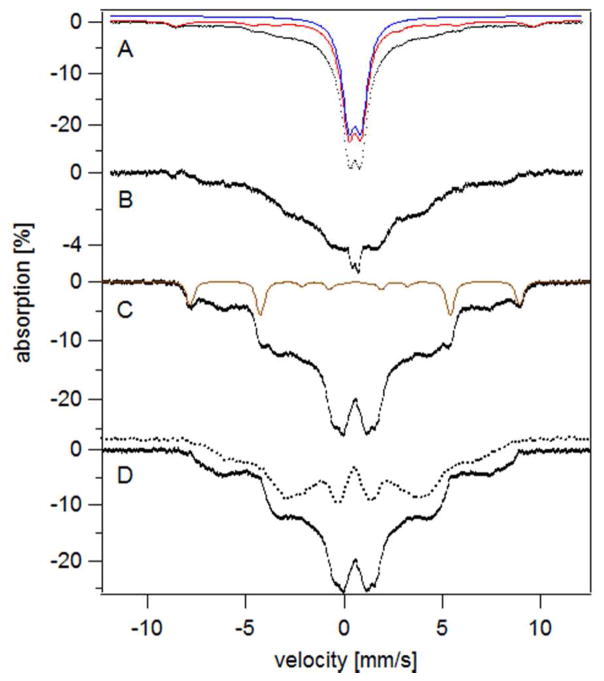
Figure 6.
Mösbauer spectra of MM-grown yeast cells at stationary phase. A, 400 μM Fe-containing MM-grown cells at stationary phase (OD 2.2, 5-day-grown). The red line simulates the contributions from HS FeIII, FeIII nanoparticles and the CD. The blue line simulates the ICS-mutant-type nanoparticles. B, same as A but after subtracting the red-line simulation. For A and B, the temperature was 5 K and a 40 mT field was applied parallel to γ-rays. C, same as A but at 6 T (transverse field) and 4.2 K; D, same as in C but the HS FeIII component has been subtracted. Dotted line is the equivalent MB spectrum of isolated mitochondria from Aft1-1up cells.19 The brown line simulates the HS FeIII contribution.

