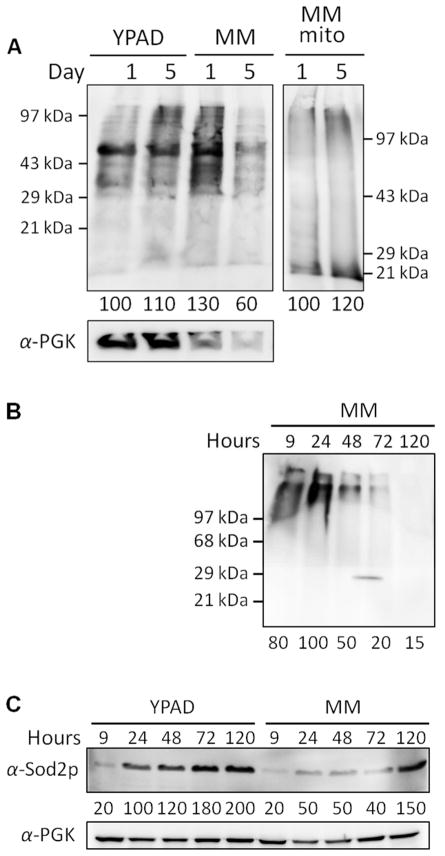
Figure 7.
Oxyblot and Western blot against Sod2p of whole cells and mitochondria harvested at different conditions. A, Oxyblot of whole-cell lysates (left panel) and mitochondrial extracts (right panel). Medium and days of growth are displayed on the top of blots. Overall band intensities (below blots) are indicated as percentages relative to YPAD/1 day (left) or MM/1 day (right) blots. B, Oxyblot time-course of whole cell lysates grown on MM. Band intensities (below blots) are indicated as percentages relative to that of MM/24 hr blot. The intensity at ~29 kDa between lanes 3–4 is an artifact. C, Western blot against Sod2p for YPAD and MM cells grown for different times (same MM samples as in B). Lane 1–5, YPAD; lane 6–10, MM; hours of growth are labeled on the top of each lane. Band intensities (below blots) are given as percentages relative to that of the YPAD/1 day blots. Each lane was developed with 4 (Oxyblot for whole cell lysates), 15 (Oxyblot for mitochondrial extracts) and 16 (Western blot against Sod2p for whole cell lysates) μg of protein.

