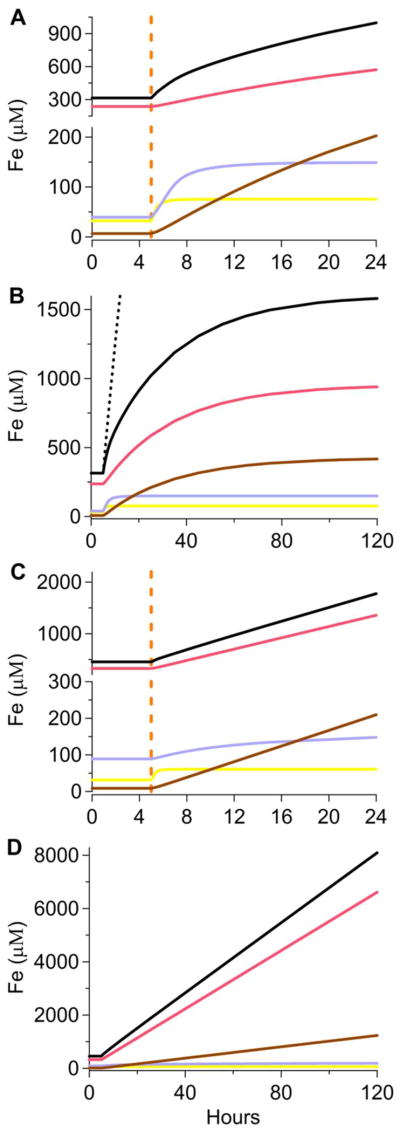
Figure 9.

Simulated kinetics of Fe uptake and trafficking in yeast cells. A, YPAD, 1-day-growth scale; B, YPAD, 5-day-growth scale; C, MM, 1-day-growth scale; D, MM, 5-day-growth scale. The first 5 hr (before the orange line) reflect exponential growth conditions while the remaining 115 hrs indicate slow-growth and steady-state modes. Black, pink, cyan, yellow, and brown lines indicate [Fecell], [FeV], [FeM], [FeC], and [FeP], respectively. Dashed line simulates [Fecell] when cell growth was set to zero while Fe import rates were set to those for exponential growth.
