
Figure 4.
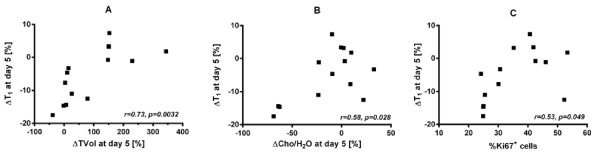
Inter-relationships of biomarkers following everolimus or vehicle treatment of RIF-1 tumours. Graphs A-C show Pearson correlations with the associated r and p values between the fractional change in T1 (ΔT1 ) and the fractional change in tumour volume (ΔTVol), the fractional change in total choline (ΔCho/H2O), and percentage of Ki67 positive cells, respectively, after 5 days of everolimus or vehicle treatment (n = 7 per group) of C3H mice bearing RIF-1 tumours.