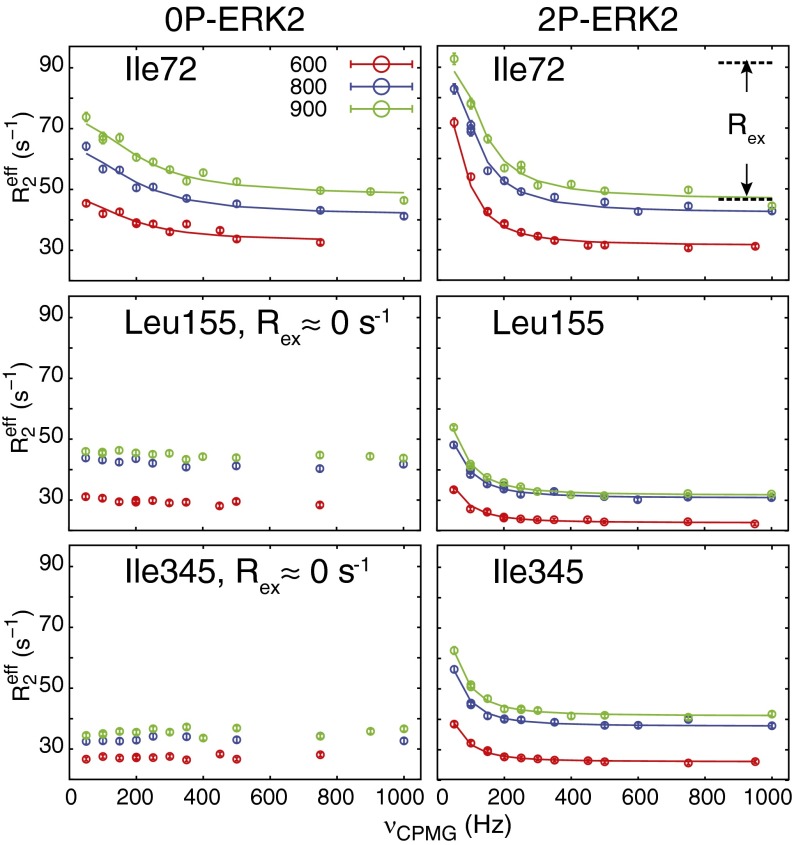
Fig. 2.
CPMG dispersion experiments show changes in methyl dynamics following ERK2 phosphorylation. The dispersion curves measured at 25 °C and 900 (green), 800 (blue), and 600 (red) MHz are shown for representative residues in 0P-ERK2 (Left) and 2P-ERK2 (Right). The Rex is shown for I72 in 2P-ERK2 at 800 MHz. Lines show individual fits to the Carver–Richards equation, and the error bars were estimated from peak intensities of duplicate measurements.

