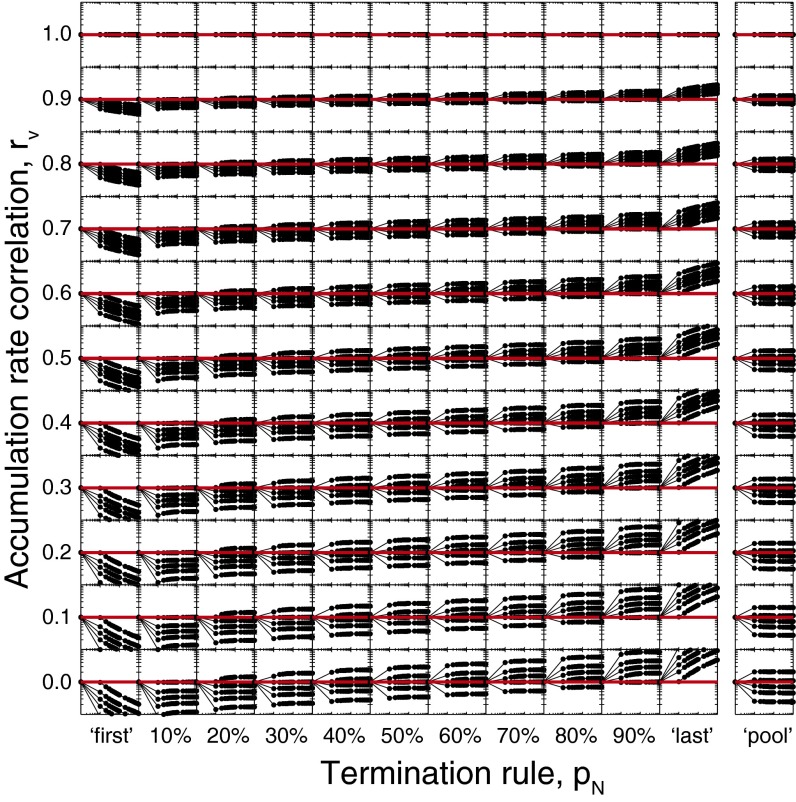
Fig. 4.
Distribution of measured activation level around RT (ART) between trials in a randomly selected accumulator as a function ensemble size (N), termination rule (pN), and accumulation rate correlation (rv). The x axis ranges from 100 to 103, and the y axis ranges from 102 to 103. Other conventions as in Fig. 2. Individual threshold (θ, red line) was identical across accumulators. Thus, correspondence between ART and θ is indicated by overlap of distributions (black lines) and threshold (red line).

