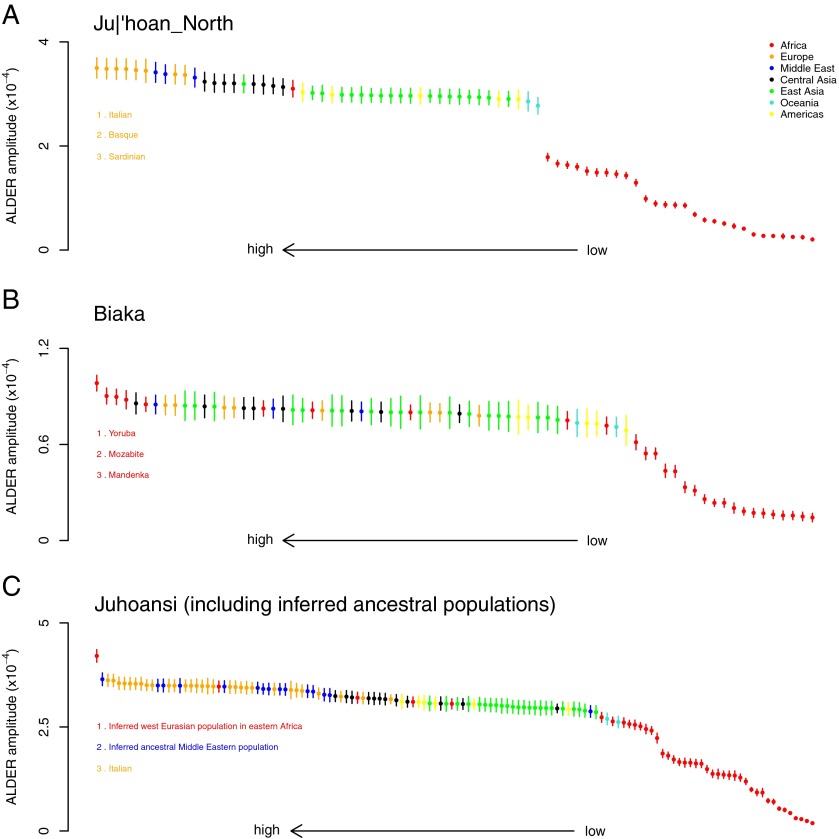
Fig. 1.
Identifying sources of admixture using LD. In each panel, we computed weighted LD curves with ALDER v1.0 using a test population as one reference and a panel of other populations as the second reference. We performed this analysis with different test populations: (A) the Ju|’hoan_North, (B) the Biaka, and (C) the Juhoansi [equivalent to the Ju|’hoan_North, but different samples genotyped on a different genotyping array (2)]. We fit an exponential decay curve to each LD curve, starting from 0.5 centiMorgans. Plotted are the fitted amplitudes for each curve; error bars indicate one SE. A larger amplitude indicates a closer relationship to one of the true admixing populations. Populations are ordered according to the amplitude and colored according to their continent of origin. The three populations with the largest amplitude (and thus the closest inferred relationship to the true mixing population) are listed. Note that the only populations from western Africa in these data are the Yoruba and Mandenka. In C, we include as references two inferred populations: the inferred west Eurasian population that entered Ethiopia (see main text for details) and an inferred Middle Eastern population before admixture with African populations (24).

