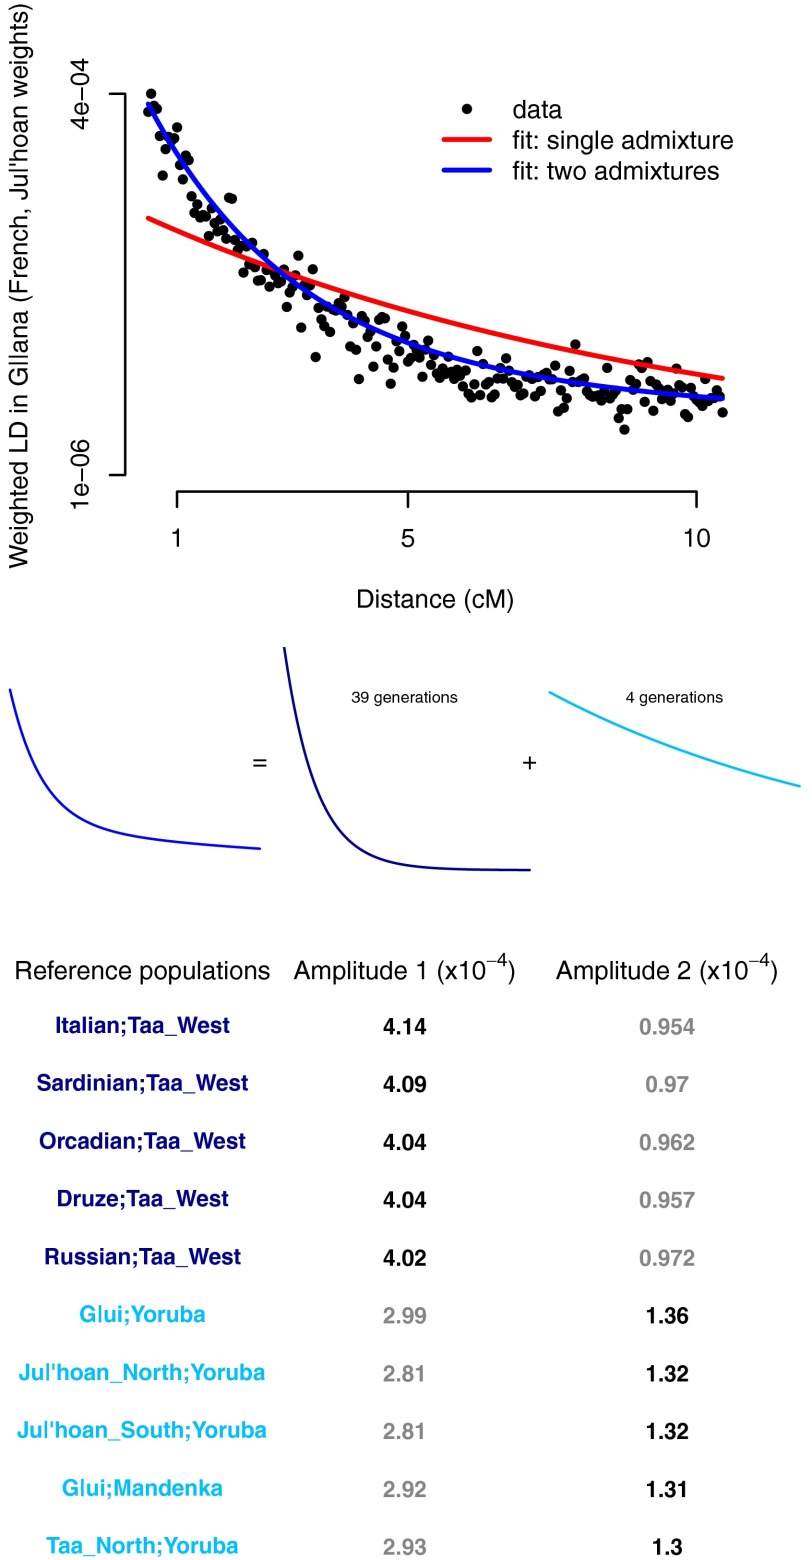
Fig. 3.
LD evidence for multiple waves of mixture in the G‖ana. We computed 990 (45 choose 2) weighted LD curves in the G‖ana and fit two models: one with a single admixture event, and one with two admixture events. Shown is the LD curve computed using the French and Ju|’hoan_North populations as references, along with the fitted curves from the two models (note that the decay rates in the fitted curves are shared across the data for all 990 pairs of populations, not only to the shown data). Below the plot, we show a schematic representation of the fitted model with two admixture events. In the table, we show the population pairs with the five largest estimated amplitudes on each admixture event (that is, the population pairs in dark blue are those with the largest weights on the dark blue curve, and those labeled in light blue are those with the largest weights on the light blue curve).

