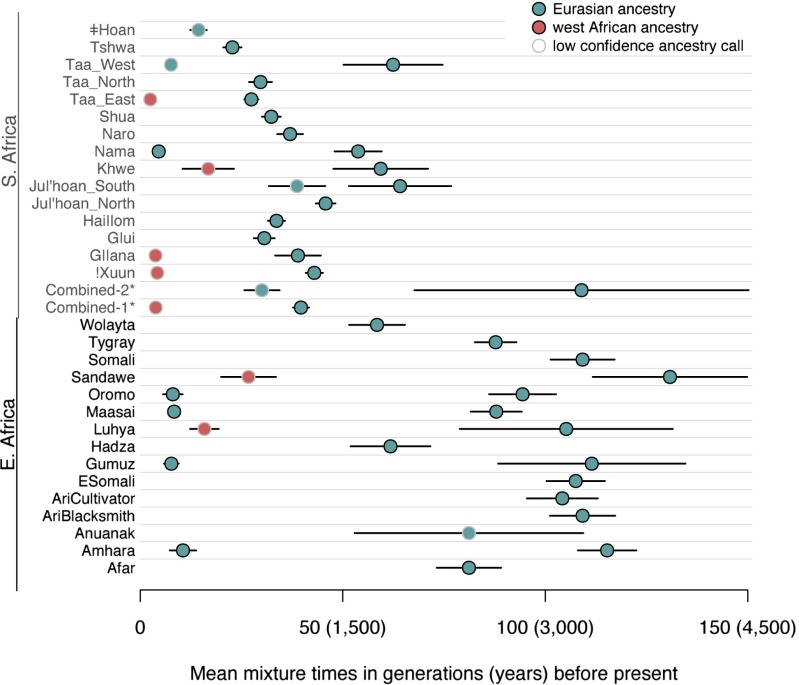
Fig. 4.
Mean times of admixture in southern and eastern Africa. For each southern or eastern African population, we estimated the number of mixture events and their dates. Plotted are the estimated dates. Black lines show one SE on the estimates. Points are colored according to the populations inferred as proxies for the mixing populations (SI Appendix). *The combined-1 population is the Tshwa, Shua, Hai‖om, ǂHoan, Naro, and Taa_North. The combined-2 population is the Ju|’hoan_North and G|ui (see main text for details).

