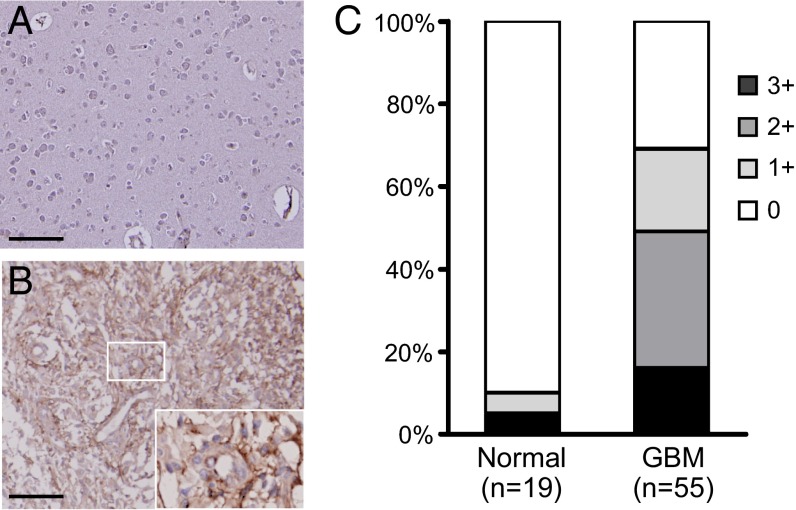
Fig. 4.
Expression of SSEA-4 in GBM. (A and B) Representative images of normal brain tissues (A) and GBM (B) after immunohistochemical staining with MC-813–70. The inset in B shows a magnified picture of the small boxed area. (Scale bars, 100 μm.) (C) Statistical results of SSEA-4 IHC. GBM specimens (n = 55) and normal brain tissues (n = 19) were counterstained with hematoxylin after IHC. The staining intensity of the tissues was graded as 0 (negative), 1+ (weak), 2+ (moderate), and 3+ (strong).

