Fig. 3.
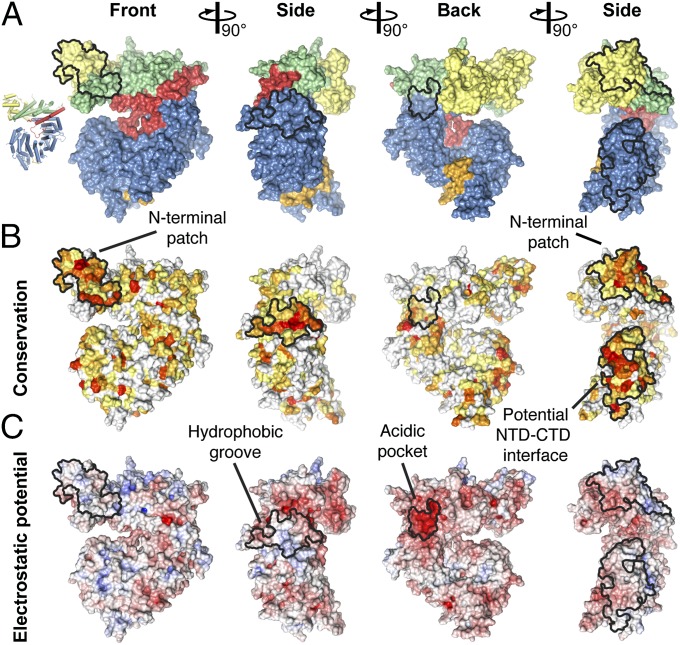
Surface properties of ctNup192NTD. (A) Surface representation of ctNup192NTD in four different orientations colored as in Fig. 1B. (B) Surface representation of ctNup192NTD colored according to conservation within seven fungal Nup192 sequences (Fig. S2). Sequence conservation is shaded from white (<45% similarity), to yellow (45% similarity), to red (100% identity). (C) Surface representation is colored according to electrostatic potential from −10 kBT/e (red) to +10 kBT/e (blue).

