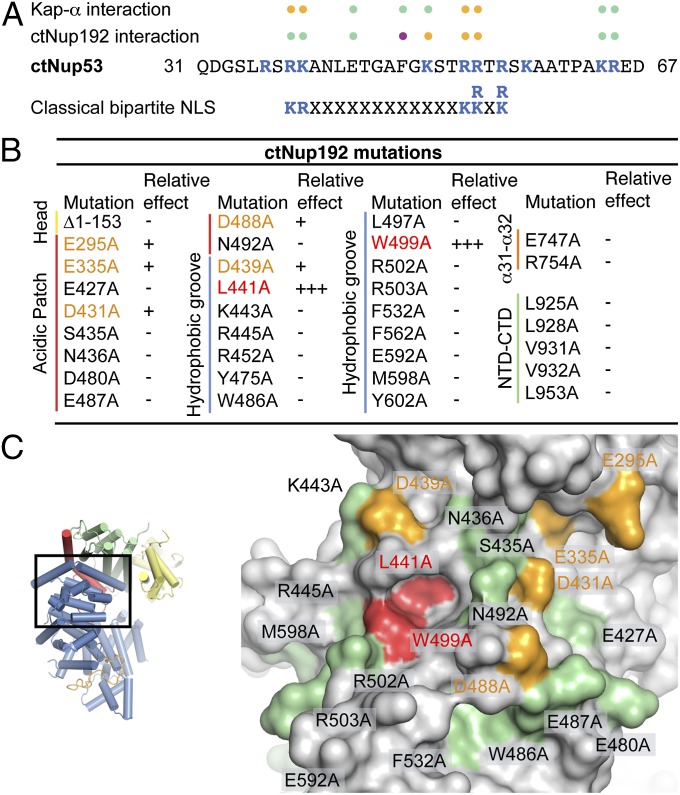
Fig. 5.
Mutational analysis of the ctNup53 interactions with ctNup192 and Kap-α. (A) Sequence comparison of ctNup5331–67 with a consensus classical bipartite NLS and summary of the effects of ctNup5331–67 mutations on ctNup192NTD and Kap-α binding. Basic residues are highlighted in blue, and dots indicate mutations that cause no effect (green), reduced binding (orange), or complete disruption (purple) (Fig. S6 A and B). (B) Mutational analysis of the ctNup192NTD–ctNup5331–67 interaction. Mutations that have no effect (−, black), reduce binding (+, orange), or abolish the interaction (+++, red) are indicated (Fig. S7A). (C, Right) Surface mapping of ctNup192NTD mutagenesis results. (C, Left) As a reference, a cartoon representation of ctNup192NTD, colored as in Fig. 1B, is shown. The locations of mutations on the ctNup192NTD surface are labeled and colored in green, orange, and red to indicate no effect, reduced binding, or complete disruption of ctNup5331–67 binding, respectively.

