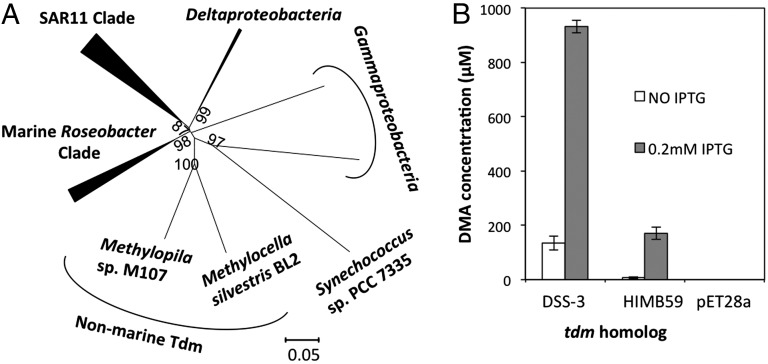
Fig. 2.
(A) Neighbor-joining phylogenetic analysis of Tdm retrieved from the genomes of sequenced marine bacteria. Bootstrap values (500 replicates) greater than 60% are shown. The scale bar denotes the number of amino acid differences per site. The analysis involved 49 Tdm sequences. There were a total of 468 amino acid residues in the alignment. Evolutionary analyses were conducted in MEGA5.1 (52). (B) Production of DMA from TMAO demethylation by recombinant Tdm of R. pomeroyi DSS-3 and Pelagibacteraceae strain HIMB59. pET28a represents the control empty vector with no insert. Error bars denote SDs of triplicate measurements. IPTG, isopropyl β-d-1-thiogalactopyranoside.

