Fig. 6.
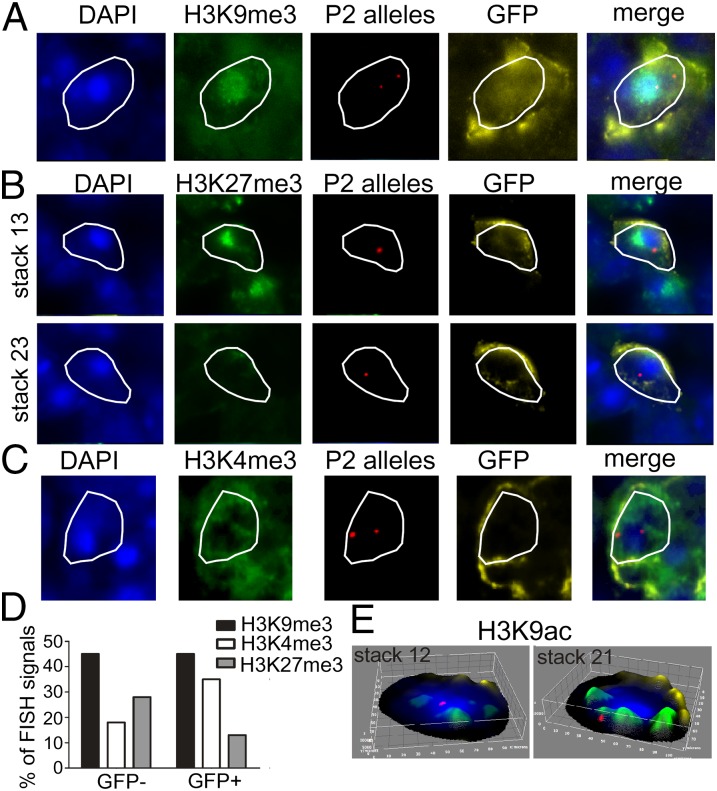
Positioning of the active P2 OR genes. (A–C) Representative immuno-DNA FISH images of GFP positive olfactory neurons (yellow) showing the P2 OR gene loci (red), heterochromatin marks as indicated (green), and DAPI (blue). In the neuron in A, one P2 allele is colocalized with H3K9me3 and the other one is not. In the neuron in B, one allele is colocalized with the constitutive heterochromatin block (in stack 13) and the other one is not colocalized with the constitutive heterochromatin block nor with H3K27me3 (in stack 23). In the neuron in C, one P2 allele is colocalized with H3K4me3 and the other one with the constitutive heterochromatin block. (D) The graph shows the percentages of the total number of P2 OR DNA FISH signals that colocalize with H3K9me3 (n = 40 and 20), H3K4me3 (n = 40 and 20), or with H3K27me3 (n = 120 and 40) in GFP− or GFP+ neurons. (E) Surface plots of an olfactory nucleus showing H3K9ac in green, GFP in yellow, and the P2 OR gene loci in red. The allele visualized in stack 12 is associated with the constitutive heterochromatin block, and the allele visualized in stack 21 is localized near H3K9ac.

