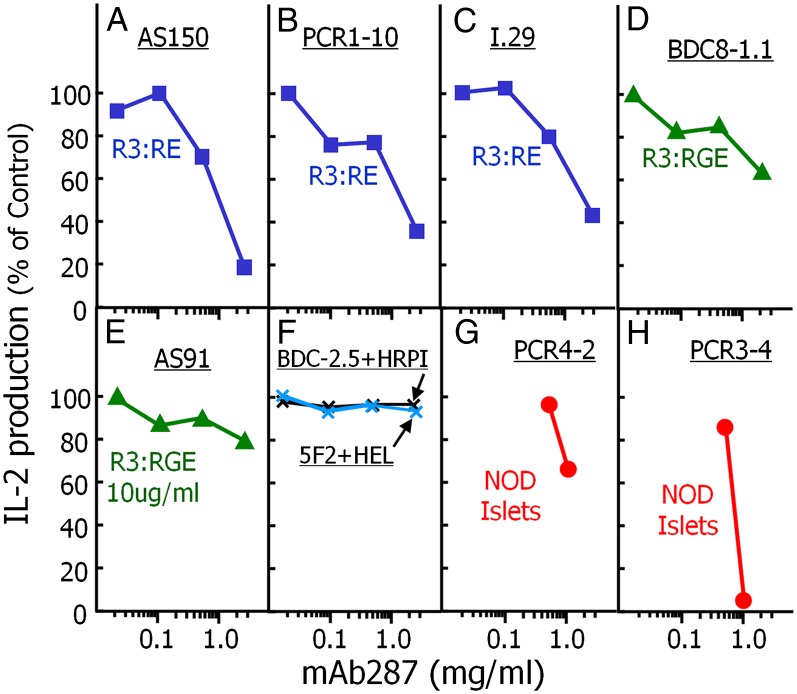
Fig. 2.
Specific inhibition of in vitro responses of insulin-specific T-cell hybridomas/transfectomas by mAb287. The ability of mAb287 to inhibit the responses of eight different T cells was assessed in vitro. Type A T cells (56) that prefer Insulin B:21E (blue): AS150 (A); PCR1-10 (B); I.29 (C). Type B T cells (56) that prefer Insulin B:21G (green): AS91 (D); BDC8-1.1 (E). Control T cells: BDC-2.5 specific for ChgA (black) and 5F2 specific for HEL (blue) cells. In A–F, for each T-cell, NOD spleen cells were used as APCs to present a concentration of a peptide known to activate the T-cell sufficient for a response of ∼100 pg/mL of IL-2: R3:RE, 100 µg/mL (A); R3:RE, 5 µg/mL (B and C); R3:RGE, 10 µg/mL (D); R3:RGE, 1 µg/mL (E); ChgA mimotope HRPI and HEL, both 1 µg/mL (E). Other insulin reactive T cells (red): PCR4-2 (type A T cells) (G) and PCR3-4 (type B T cells) (H) were stimulated with 100 NOD islet cells as a source of both natural insulin antigen and APCs. For all 8 T cells, various concentrations of mAb287 were added at the initiation of culture and IL-2 production was assayed at 18 h. Secreted IL-2 was measured as described in Materials and Methods, and the results are shown as the percent of the response remaining compared with the no mAb287 control. The experiment was performed three times with similar results.

