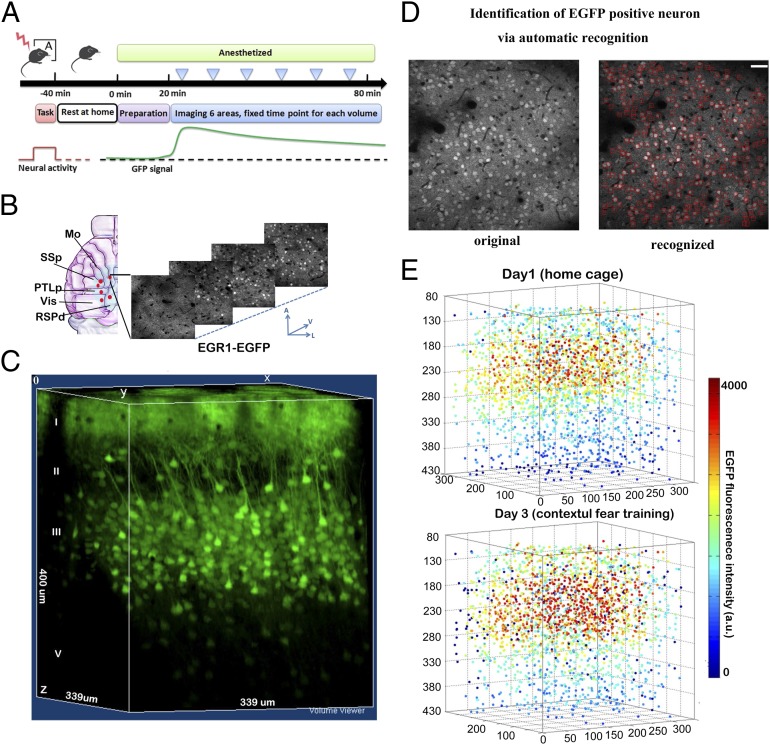
Fig. 1.
Digitized reconstruction of the EGR1-EGFP signals to track neuronal activation in the same cortical volume on different tasks. (A) Standard experimental procedure to measure the task-induced EGFP signal in mice. Individual cortical volume was imaged at the same time point after the training for different trials to compare signal differences between behavior tasks. (B) Multiple cortical volumes were imaged within the blue area at the z-step of 2 µm. Vis, visual cortex; Mo, motor cortex; SSp, primary sensory cortex; PTLp, posterior parietal association; RSPd, dorsal part of retrosplenial cortices. A, anterior; V, ventral; L, lateral. (C) Example of the 3D reconstruction of the EGR1-EGFP signals in the motor cortex. Block size, 339 × 339 × 400 µm. (D) The designed recognition system was used to identify the EGFP-positive neurons on each image according to their morphology pattern. The red squares showed the computer-recognized cells. The same cells identified in multiple optical sections were further filtered to obtain the center position of the cell. Detection errors were corrected manually after primary screening. (Scale bars, 50 µm.) (E) The example of digitized reconstruction of the cellular EGFP signals in a cortical volume for two trials (n = 3,563). Indexed color showed the EGFP fluorescent intensity.

