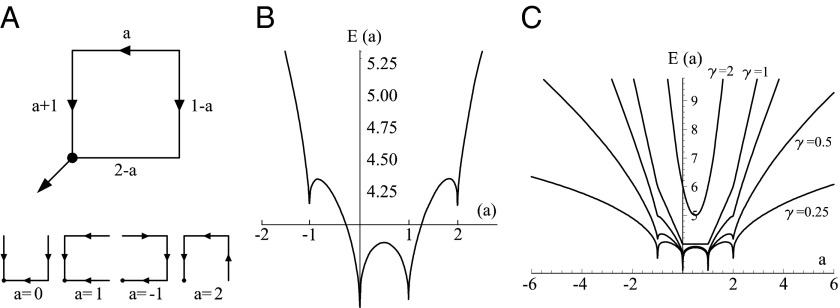
Fig. 7.
The four-bond lattice. (A) The four-node arrangement, with indications on the currents that respect continuity (note that a unit flux is injected at each node). The dot is the outlet. Here, the current a is taken as the parameter regulating the entire distribution of fluxes owing to continuity. (Lower Left) The only loopless configurations of the system are generated by integer values of a: possible trees correspond to the cases  . (B) Plot of the function E vs. a from
  (with
(with  ), which is derived by computing energy dissipation after implementation of continuity at the nodes. In particular, the plot of
  highlights that there are local minima in correspondence with one of the four currents being zero (
 ), corresponding to the four trees shown in Lower Left (SI Text). (C) Energy functions
  vs. a for the cases
  . The particular behaviors highlighted in the plot are discussed in SI Text.

