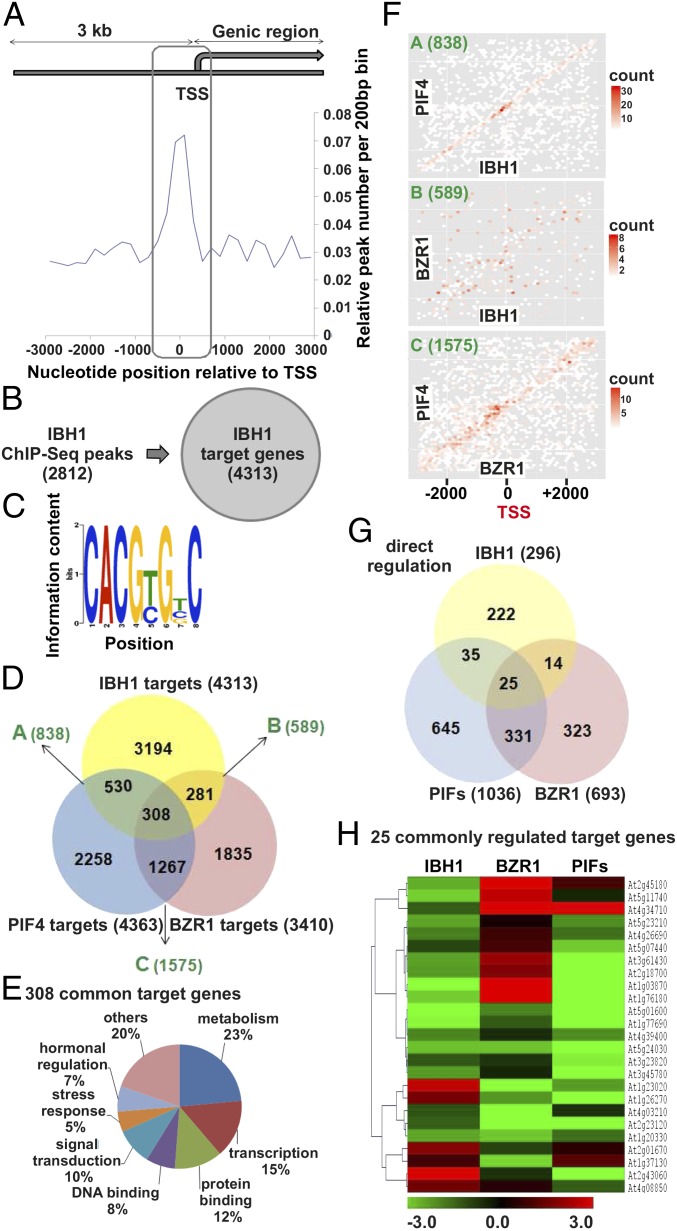
Fig. 4.
IBH1 as part of transcriptional complexes. (A) Distribution of IBH1 binding peaks (frequency) relative to gene structure (−3 kb to the coding sequence). (B) Total IBH1-binding peaks in the region shown in A and corresponding target genes identified by the ChIP-Seq analysis. (C) Frequency of cis elements around the IBH1-binding sites. The sequence logo shows the most enriched motifs in the IBH1-binding regions. (D) Overlap between the direct target genes of IBH1, PIF4, and BZR1. (E) Functional categories in the 308 direct target genes shown in D (P < 0.05). (F) Genome colocalization of binding sites of IBH1, PIF4, and BZR1 along the promoter 3,000 bp upstream of the TSS and in the downstream genic region. The frequency of peak pairs is represented by a color scale. Counts are numbers of peak pairs in a certain area. (G) Overlap between the directly regulated targets of IBH1 (IBH1OE), PIF4 (pifq), and BZR1 (bzr1-D). (H) Heat map representation of the expression profiles of the 25 directly regulated genes shown in G. The color scale indicates the fold change.

