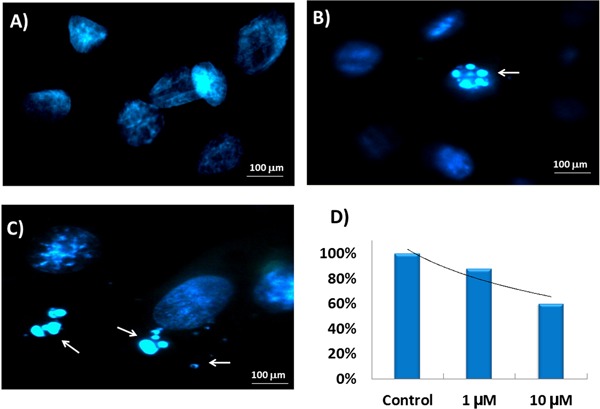
Figure 1. Nuclear morphological damage in H9c2 cells incubated with different concentrations of celecoxib for 24 h. A, 0 µM; B, 1 µM; C, 10 µM celecoxib. Cells were stained with DAPI and the arrows indicate perinuclear apoptotic/necrotic bodies. D, Percentage of nuclear morphological alteration in each group after treatment.

