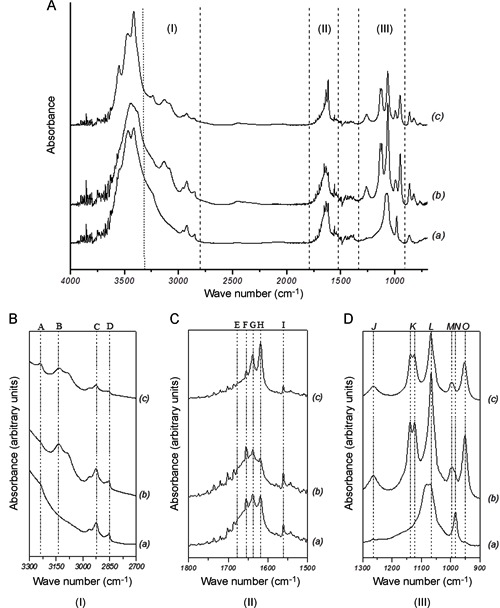
Figure 4. FTIR spectra between 4000 and 800 cm-1 of H9c2 cells after a 24-h incubation with celecoxib. A, Spectra overview: (a) 0 µM, (b) 1 µM, (c) 10 µM celecoxib. Spectra intervals: B, 3300 to 2700 cm-1 (I); C, 1800 to 1500 cm-1 (II); D, 1300 to 900 cm-1 (III). A-N were assigned as bands in those spectra. Bands A, B, J-N represent changes in DNA; bands assigned from E to I represent structural changes of proteins; C and D represent general changes in cellular structures; O represents P-O stretching in phosphorylated protein.