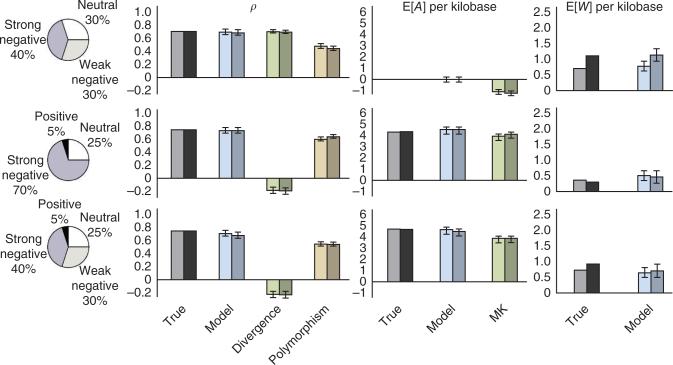
Figure 1.
Results for data sets simulated under three different mixtures of selective modes. Four selective modes (pie charts) are considered: neutral evolution (2Nes = 0), weak negative selection (2Nes = –10), strong negative selection (2Nes = –100) and positive selection (2Nes = 10). Bars represent the fraction of nucleotides under selection (ρ) and the expected numbers of adaptive substitutions (E[A]) and weakly deleterious polymorphisms (E[W]) per kilobase of transcription factor binding site sequence analyzed. Separate bars are shown for true values in the simulations and model-based estimates. Estimates of ρ are additionally compared with simple estimators based on divergence and polymorphism rates, and estimates for E[A] per kilobase are compared with a McDonald-Kreitman–based estimator (MK). The first bar in each pair represents simulations with constant population sizes, and the second bar represents a realistically complex demographic scenario for human populations. The nonzero values of E[W] per kilobase in the absence of weak negative selection (second row) reflect residual polymorphism in strongly selected sites. Error bars, 1 s.e.m. (additional results are shown in supplementary Figs. 12 and 13, and further details are given in the supplementary Note).

