Figure 4.
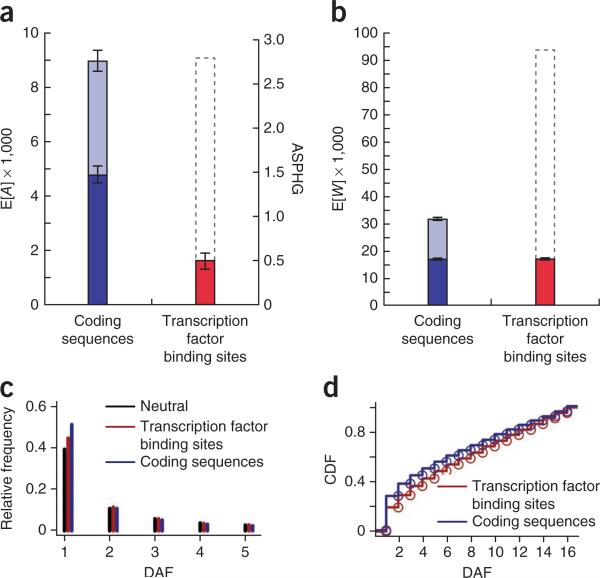
Genome-wide analyses of adaptive and deleterious mutations in protein-coding sequences and transcription factor binding sites. (a) Expected numbers of adaptive substitutions on the human lineage (E[A]). The analysis was performed on a subset of genes that passed rigorous data quality filters (dark blue), and results were extrapolated to a full set of genes (light blue) (supplementary Note). The gray dashed outline for transcription factor binding sites indicates a crude extrapolation to the entire genome, assuming that two nucleotides function in gene regulation for every one that encodes proteins. The alternative y axis (right) shows estimated adaptive substitutions per hundred generations (ASPHG). Error bars indicate 1 s.e.m. above and below the mean (supplementary Note). (b) Plot as in a showing expected numbers of weakly deleterious polymorphisms (E[W]). (c) Site frequency spectra (SFS) for polymorphic sites in transcription factor binding sites, coding sequences and neutral flanking sequences. The first 5 derived allele frequencies (DAFs) are shown as counts out of 108 chromosomes (complete results in supplementary Fig. 15). (d) Cumulative distribution function (CDF) for expected weakly deleterious mutations per haploid genome (E[D]) in transcription factor binding site and coding sequences. Notice that the distribution is shifted toward more common alleles in transcription factor binding sites. Results are similar with alternative thresholds for low-frequency alleles.

