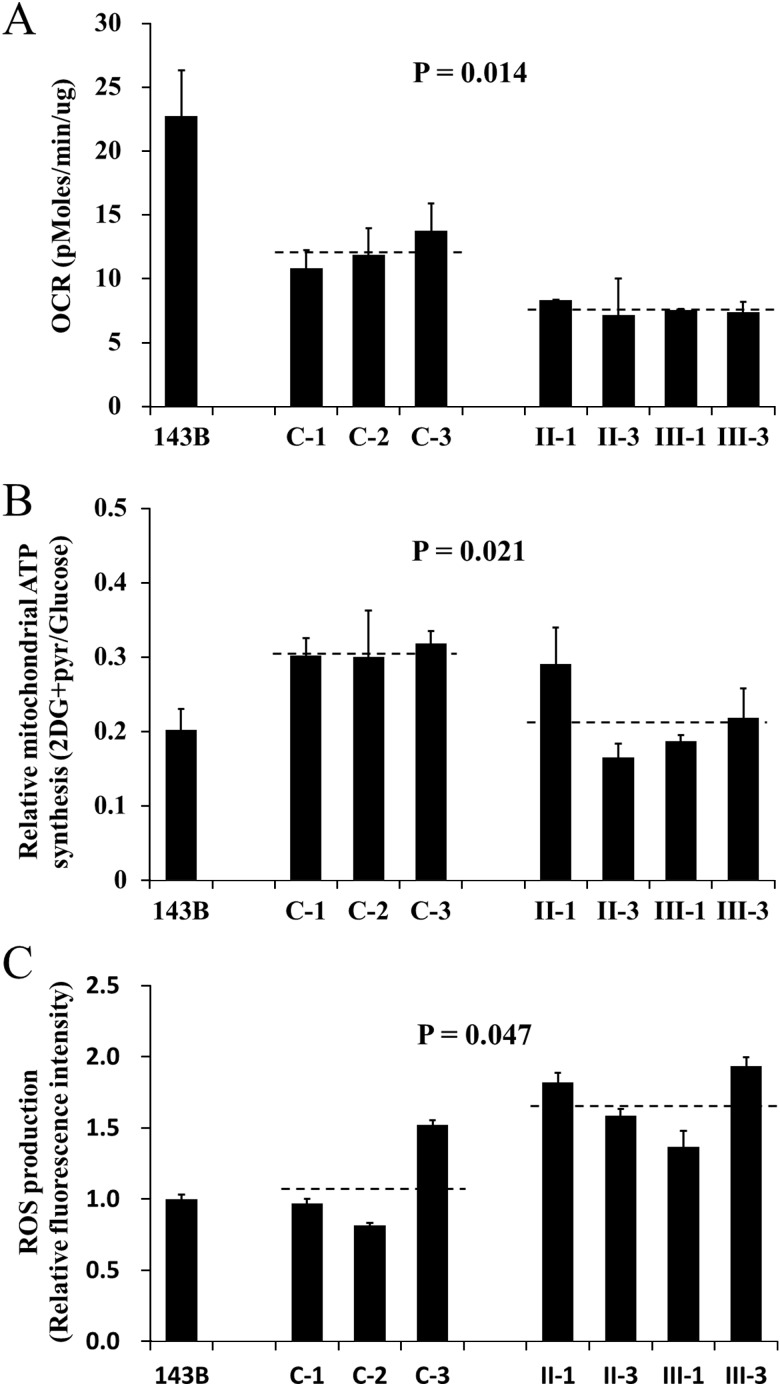
Figure 4.
Determination of mitochondrial function. The 143B cell line was used as a control. The average of three determinations for each cell line is shown. (A) The oxygen consumption rate of the mutant lymphoblastoid cell lines derived from the maternal members (II-1, II-3, III-1 and III-3) of this Han Chinese family and three control individuals (C-1, C-2 and C-3) was determined with Seahorse Bioscience XF96 extracellular flux analyzer (Seahorse Bioscience). (B) The ATP level in mutant and control cell lines was measured with either 10 mM glucose (total ATP production) or 5 mM 2-deoxy-d-glucose (2-DG) plus 5 mM pyruvate (oxidative ATP production), and the relative mitochondrial ATP synthesis was defined as the ratio of oxidative ATP production to total ATP production (2DG+pyr/glucose). (C) The rates of reactive oxidative species production in mutant and control cell lines were analysed. The relative fluorescence intensity without stimulation of H2O2 was calculated in relation to 143B.

