
Figure 4. SNP association analysis of white blood cell counts in HMDP population.
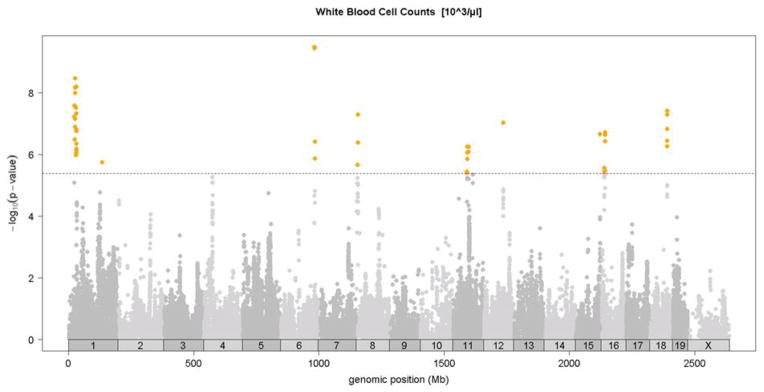
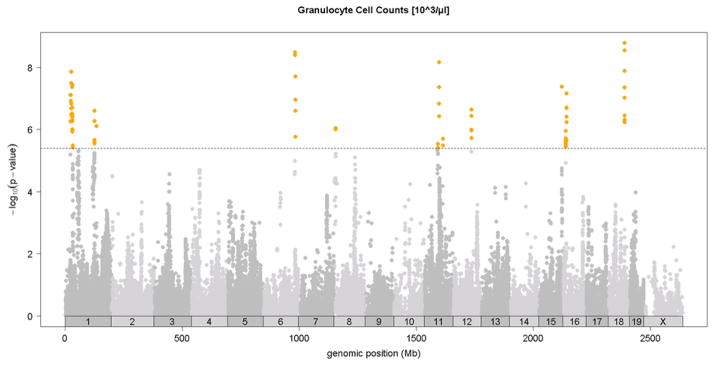
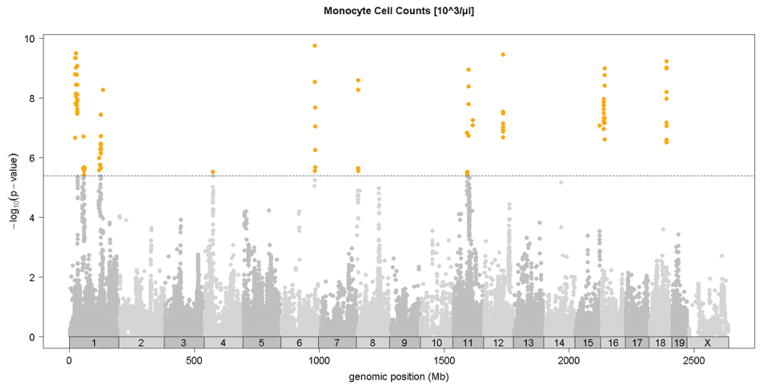
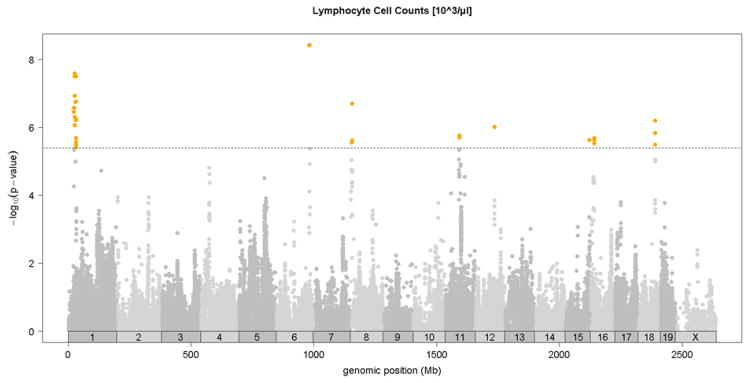
Shown are the associations for about 107,000 SNPs with genomic position on the x-axis and significance of association (−log10 p-value) on the y-axis. Dashed horizontal line at p= 4.1 E-6 is threshold for genome-wide significance. Cell counts (103/ul) for A. total white blood cells (WBC), B. granulocytes (GRAN), C. monocytes (MONO) and, D. lymphocytes (LYMP). Absolute genomic position (Mb) for each SNP is indicated below the X-axis while chromosome number is shown immediately above.