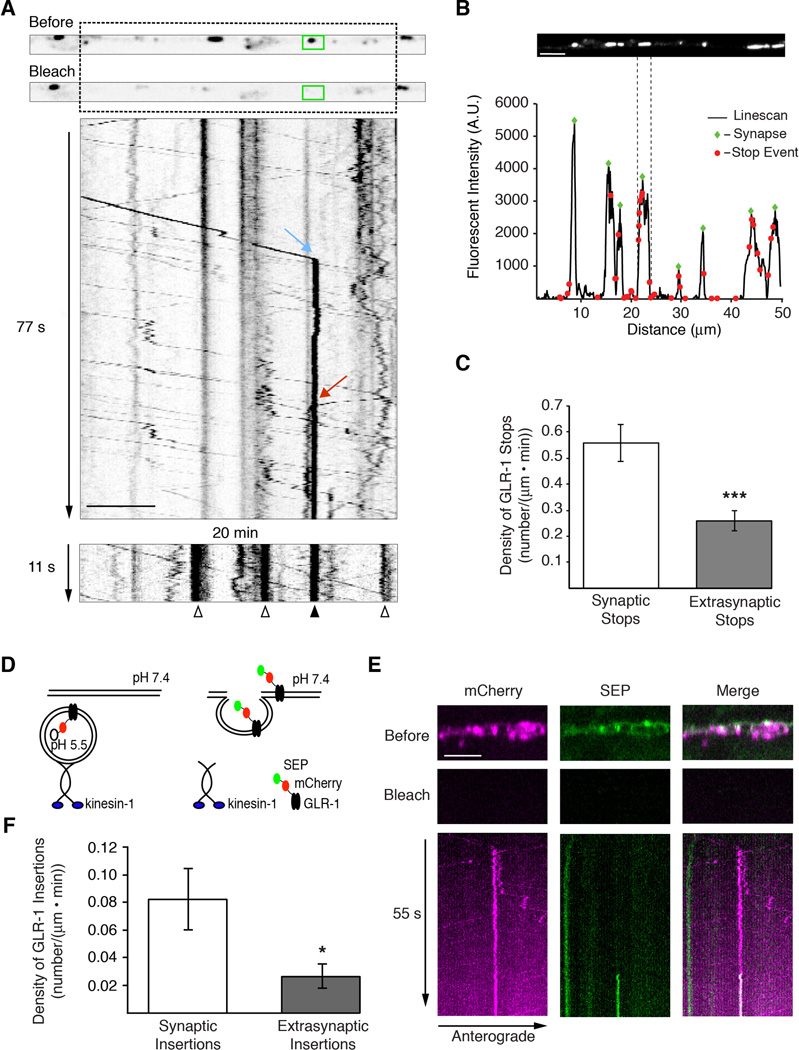
Figure 2. GLR-1 is preferentially delivered to synaptic puncta in the AVA processes.
(A) Single plane confocal images before and after photobleaching GLR-1∷GFP in the AVA processes with the corresponding kymograph showing anterograde (blue arrow) and retrograde (red arrow) delivery events to a synaptic puncta (green box). A second kymograph (bottom), taken 20 minutes after the first, shows the stable delivery event from the first kymograph (filled arrowhead), as well as additional delivery events during the interval between the two kymographs (open arrowheads). (B) Confocal image of synaptic GLR-1∷GFP puncta in AVA (top) and the corresponding linescan of fluorescence intensity (bottom). Green diamonds mark the peak fluorescence of synaptic puncta and red dots mark the relative positions of GLR-1∷GFP vesicle stops from a 5 minute movie. (C) Quantification of GLR-1∷GFP vesicle stops in synaptic and extrasynaptic regions, n=7. (D) Cartoon schematic of the double-tagged SEP∷mCherry∷GLR-1 in transport vesicles and on the cell surface. (E) Simultaneous two-color confocal imaging of SEP∷mCherry∷GLR-1. Single plane confocal images taken before and after photobleaching (top) and the corresponding kymograph (bottom) showing GLR-1 transport (mCherry signal) and GLR-1 insertion into the membrane (SEP signal). (F) Quantification of GLR-1 insertion events in synaptic and extrasynaptic regions, n=10.
* p<0.05, *** p<0.001. Scale bars represent 5 µm. Error bars indicate SEM.
See also Figure S2.

