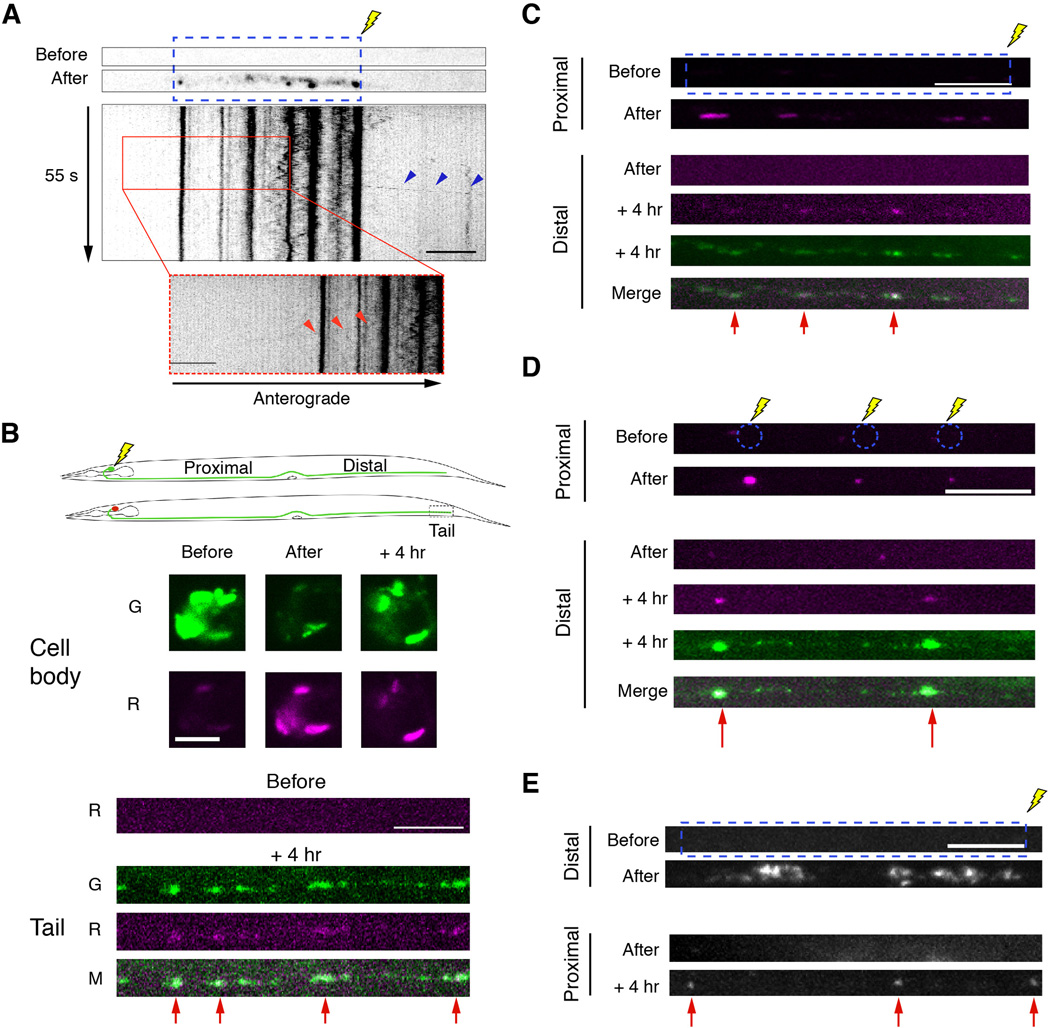
Figure 3. GLR-1 is redistributed between synapses.
(A) Photoactivation of GLR-1∷PAGFP expressed in AVA before and after UV photoactivation (blue, dashed box) with the corresponding kymograph. Arrowheads show anterograde (blue arrowheads) and retrograde (inset, red arrowheads) departure of a GLR-1 vesicle from converted synaptic puncta. (B–E) All confocal images were taken before, immediately after, or 4 hours after photoconversion or photoactivation. (B) Schematic of GLR-1∷Dendra2 photoconversion in the cell body (top). Images of GLR-1∷Dendra2 in the cell body and in the distal processes (tail). Red arrowheads highlight synapses that received photoconverted GLR-1∷Dendra2 from the cell body. (C and D) Images of GLR-1∷Dendra2 after photoconversion of total fluorescence (C) or puncta fluorescence only (D) in the proximal processes (only the red signal is shown). Red arrows indicate the appearance of photoconverted GLR-1∷Dendra2 at distal synapses (red and green signal shown). (E) Images of GLR-1∷PAGFP before and after photoactivation. Red arrows indicate the appearance of photoactivated GLR-1∷PAGFP at proximal synapses.
Scale bars represent 5 µm.
See also Figure S3.

