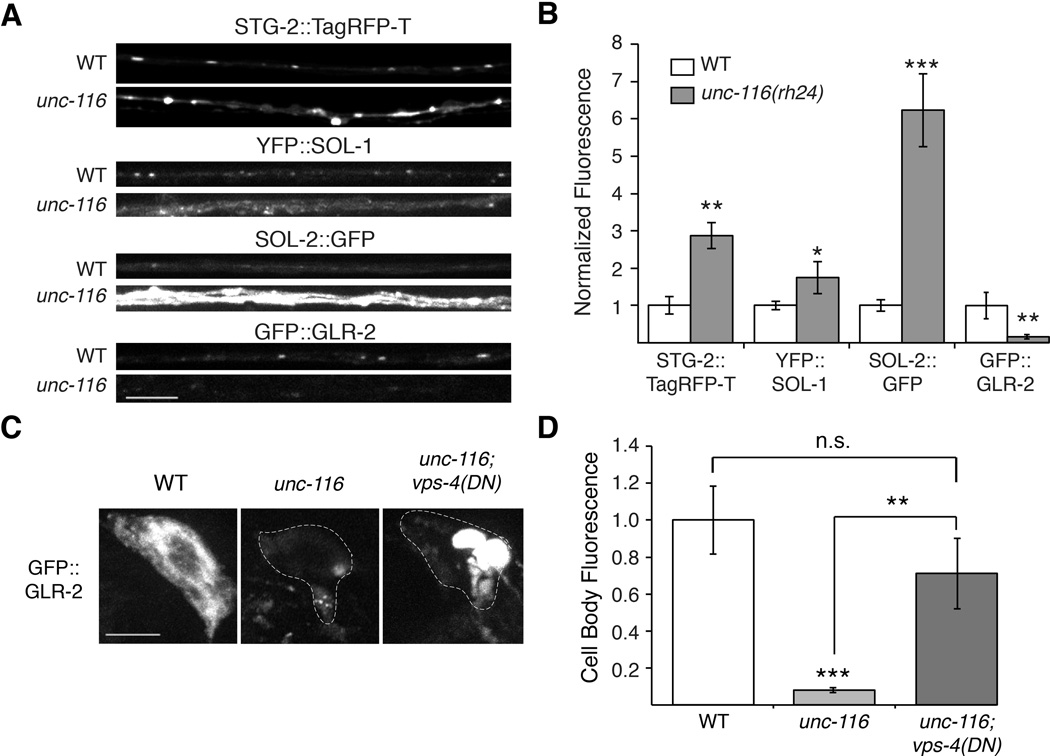
Figure 8. GLR-2 is decreased in unc-116 mutants.
(A) Confocal images of STG-2∷TagRFP-T, YFP∷SOL-1, SOL-2∷GFP and GFP∷GLR-2 in the AVA processes in transgenic WT and unc-116(rh24) mutants. (B) Quantification of synaptic puncta fluorescence normalized to WT, n>15 worms. (C and D) Confocal images of GFP∷GLR-2 in the AVA cell bodies (C) and corresponding quantification (D) in WT, unc-116(rh24) and unc-116(rh24); vps-4(DN) double mutants. For all genotypes, n≥8 worms.
* p<0.05, ** p<0.01, *** p<0.001. Scale bars represent 5 µm. Error bars indicate SEM.

