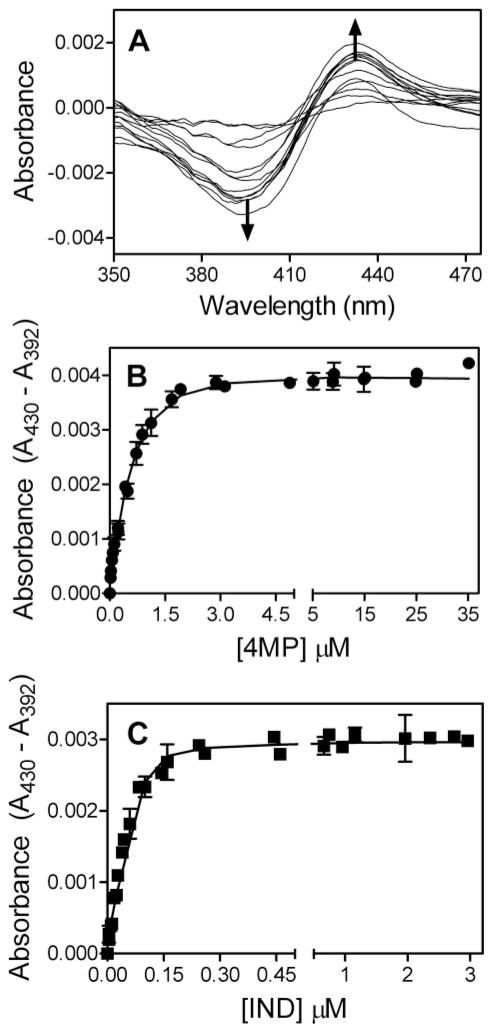
FIGURE 3. Type II difference spectra for CYP2E1 binding 4MP and IND.
Titrations were performed using tandem cuvettes to correct for any solvent effects on CYP2E1 absorbance and possible contributions from titrant to observed changes in absorbance. In the process, we generated difference spectra by substrating the reference CYP2E1 sample with solvent from the absorbance of the sample with titrant present. Specifically, 0.1 μM CYP2E1 in 50 mM potassium phosphate, pH 7.4, 20 μM DLPC was titrated with increasing amounts of ligand at 25 °C. The reported values reflect the average from 6 experiments, including the mean ± S.D. A, typical type II binding spectra for these heterocyclic molecules. B, 4MP titration data were fit to the two-site model in Scheme 3. C, IND titrations were performed in the presence of 0.25% methanol. Data were fit to the single-site model in Scheme 3.

