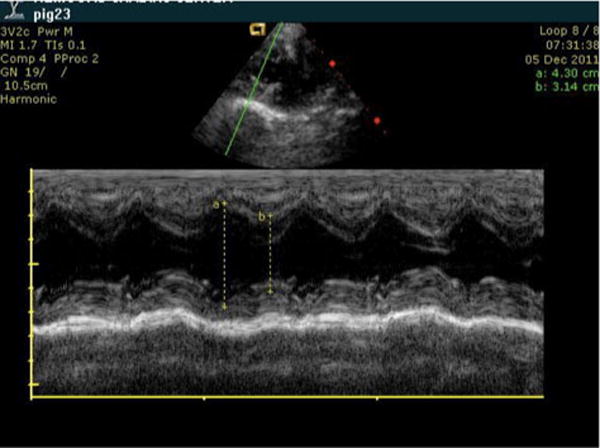
Fig. 1.

Representative echocardiographic image demonstrating how the measurements were obtained for the shortening fraction. After obtaining maximum and minimum distances of the left ventricle along the short axis, the shortening fraction was calculated using the equation [(max−min)/max]. Measurements were taken using parasternal short axis view at the level of the papillary muscles.
