Fig. 2.

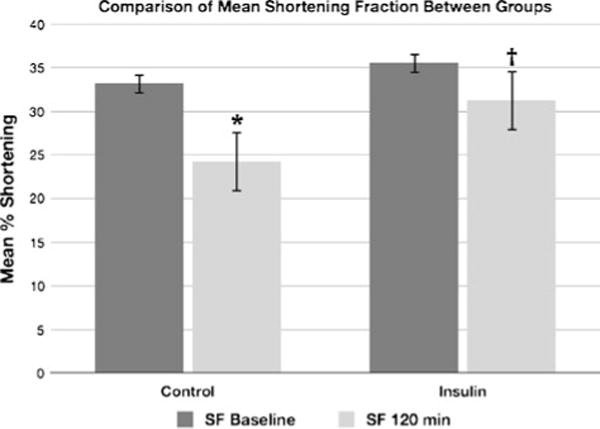
Difference in shortening fraction from baseline measurements to measurements obtained 2 h after initiation of the toxin infusion in the insulin and control groups. *P=0.019. †P=0.213.

Difference in shortening fraction from baseline measurements to measurements obtained 2 h after initiation of the toxin infusion in the insulin and control groups. *P=0.019. †P=0.213.