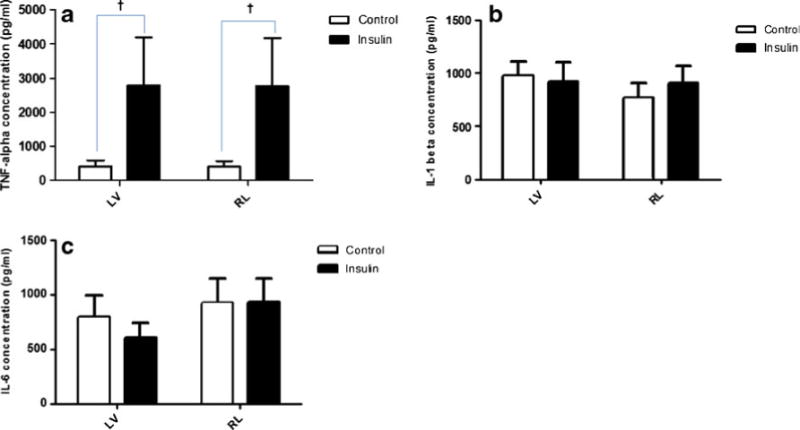
Fig. 4.

TNF-α (a), IL-1β (b), and IL-6 (c) concentrations in heart homogenates from left and right ventricles at the endpoint of the experiment for the control and insulin groups. The mean TNF-α concentration of the insulin group was greater than that of the control group (P>0.05). There was no significant difference between the groups in mean IL-1β and IL-6. Data are mean ± SEM and n=7 for each condition. †P>0.05 for group.
