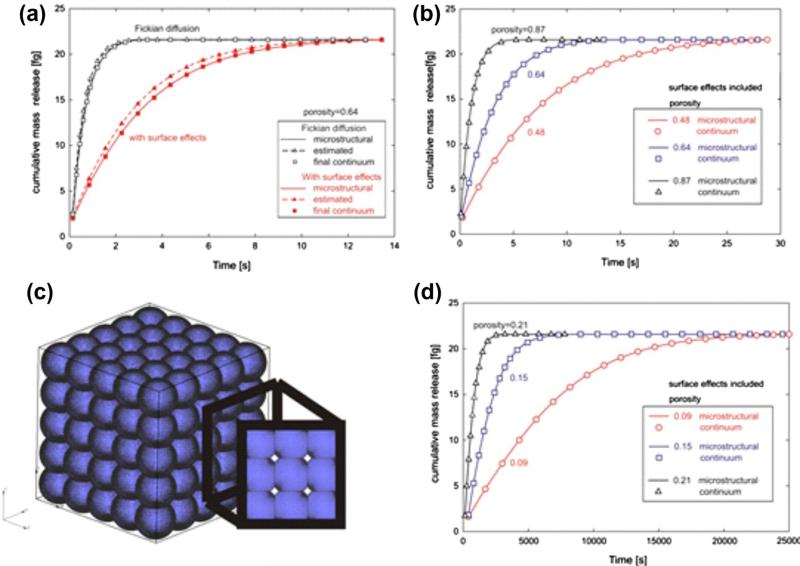
Fig. 10.
Mass release curves for microstructural and continuum models. (a) Diffusion conditions are as described in the caption of Fig. 7. Fickian and surface-affected diffusions are included. Initial continuum mass release curves are calculated using estimated constitutive parameters for the equivalent diffusion coefficient and equivalent distance from surface, and matching of the final continuum solutions (after several iterations from the initial, estimated values) with the microstructural results is achieved; (b) Microstructural and final continuum mass release curves, with surface effects included, for three porosities, for the case when the silica nanospheres are separated as in Fig. 7a; (c) Microstructure consisting of intersecting silica nanospheres; porosity is 9%; (d) Mass release curves for model with intersecting spheres and for three small porosities (9%, 15%, 21%); the time scale is three orders-of-magnitude greater than in Fig. 10b.

