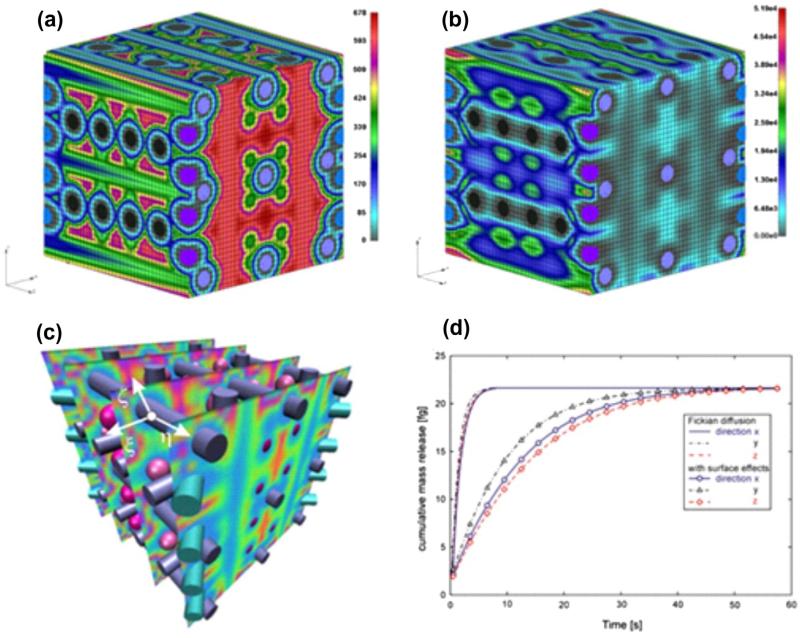
Fig. 11.
Diffusion through a medium with the complex microstructure. (a) Distribution of the x-direction diffusion coefficient Dx on the RV surface at time t = 0.4 s; values span from Dx = 0 (at the solid surfaces and within the solid) to Dx = 678 μm2s.Finite element mesh is shown, porosity is 65%; (b) Distribution of the x-direction flux Jx, displaying a similar character as Dx; (c) Distribution of Jx over several parallel planes. The local coordinate system ξ, η, Ϛ is shown for a point at the fiber surface. (d) Mass release curves for x, y, z directions, solutions obtained using microstructural and continuum models. Scaling functions for all solid constituents are taken to be the same (shown in Fig. 7b). Equivalent diffusion coefficients are (μm2/s): D̄x = 148.2, D̄y = 201.4, D̄z = 164:6, and the equivalent distances are (nm): h̄z = 0.53. Although the smallest diffusion coefficient is in the x-direction (hence, mass release kinetics should be the slowest), the slowest mass release is in z-direction since the equivalent distance h̄z < h̄x.

