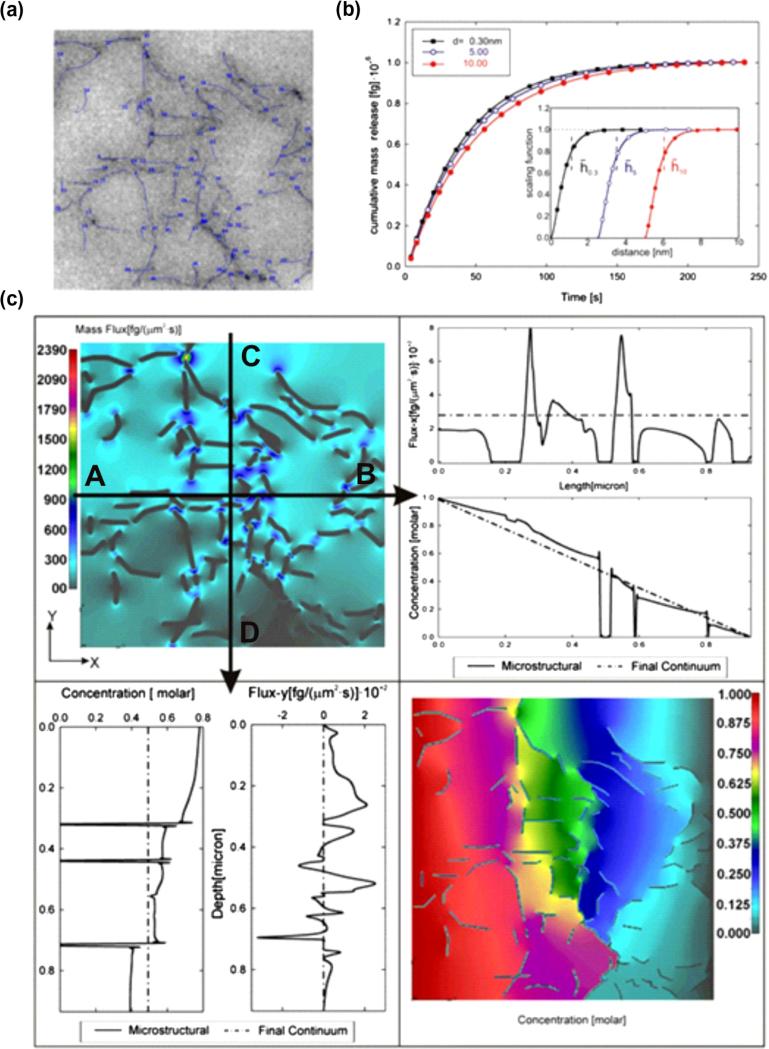
Fig. 12.
Diffusion within an agarose polymeric solution. (a) Internal microstructure obtained by TEM imaging [43] with discretized fibers. The bulk diffusion coefficient is considered independent of concentration, Dbulk = 286 μm2/s. The equivalent diffusion coefficients (in μm2/s) are: 274, 261, 250 and equivalent distances from surface (in nm) are: 1.12, 3.49, and 6.06 for particle diameters 0.3, 5 and 10 nm, respectively. (b) Mass release curves for three particle diameters 0.3 (rhodamine 6G), 5 and 10 nm. Solutions are the same for microstructural and continuum models. The inset shows the scaling functions for the three particles (displaced to the right for increasing particle radius). (c) Results shown in this figure are for particle size of 5 nm. Upper left panel: Mass flux-x distribution at time t = 0.5 s; dark contours within the field show zero-flux at fiber points. Upper right panel: Distribution of mass flux and concentration in the x-direction, microstructural (solid line) and continuum (dashed line) solutions along line A–B; zero-values of flux and concentration correspond to fibers. Continuum model solutions show approximately constant flux-x and linear decrease of concentration along A–B line. Lower left panel: Distribution of y-direction mass flux and concentration, microstructural (full line) and continuum (dashed line) solution along line C–D; zero-values of flux and concentration correspond to fibers. Continuum model shows constant concentration along B–C line, while mass flux is equal to zero, since there is no diffusion through lateral (y-direction) boundaries of the RV. Lower right panel: Distribution of concentration at time t = 0.5 s, microstructural model; concentration decreases along the x-axis, while zero-values correspond to fibers.

