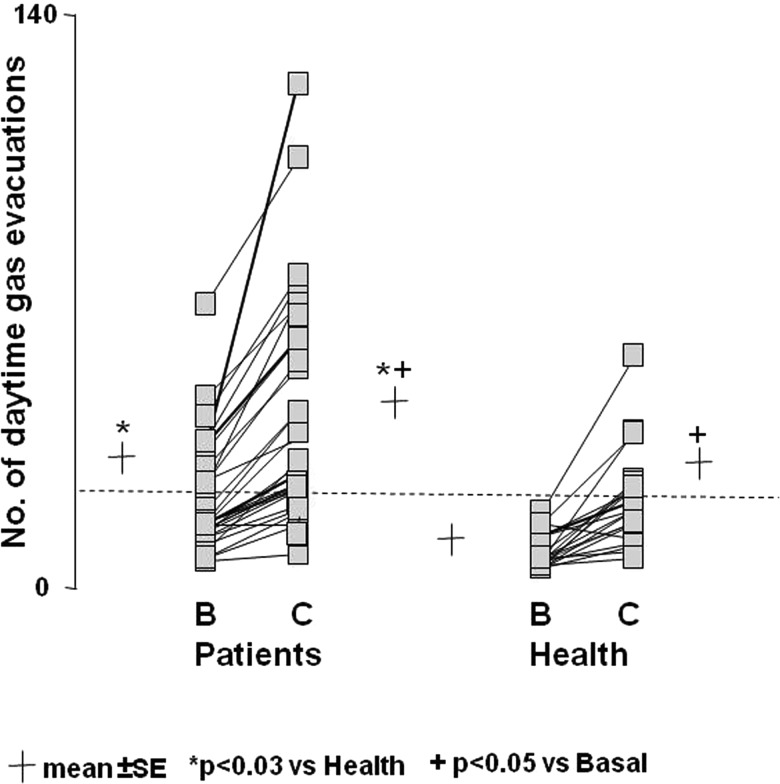
Figure 1.
Effect of diet on the number of daytime anal gas evacuations. Note the higher number in patients than in healthy subjects both during basal (B) and challenge diet (C), and marked increase during challenge diet. Data are individual values (average of three daily measurements during basal phase and last 2 days challenge phase). Dotted line represents upper limit of normal range during basal diet.

