
Figure 4. Attenuated angiogenic potency in endothelial cells but not in bone marrow progenitor cells of male ARKO mice.
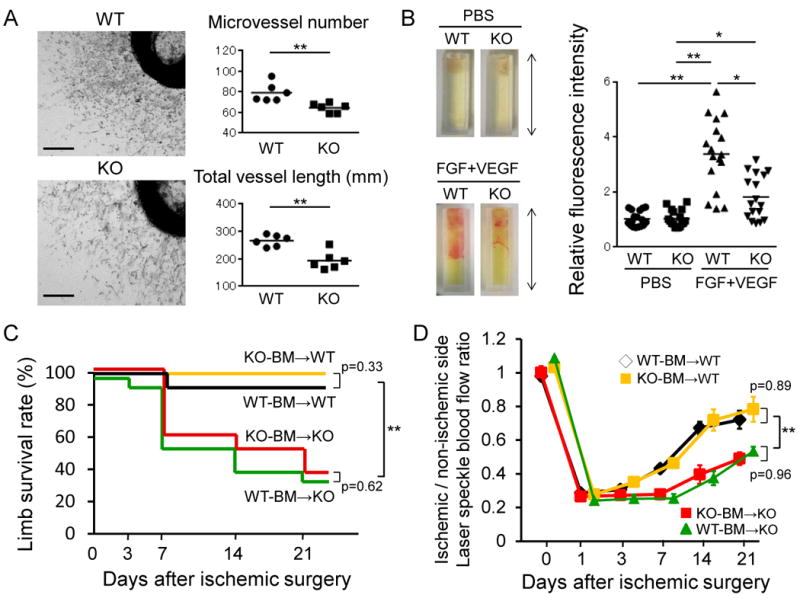
(A) Aortic ring assay. (A, left) Micrographs of representative aortic ring microvessels from male WT and male ARKO mice grown in the presence of growth factors at day 7. Scale bar indicates 0.5 mm. (A, right) Microvessel number and total length of microvessel were quantified. n=6 in each group. (B) In vivo angiogenesis using a Directed In Vivo Angiogenesis Assay kit. (B, left) Photographs of silicone cylinders at 15 days after implantation in male WT and male ARKO mice, the capillary vessels migrated into and proliferated in silicone cylinders with angiogenic factors (FGF+VEGF) from subcutaneous vessels. The value of WT control was set as 1. n=17 in each group, 2 cylinders being implanted in each mouse. Arrowed line indicates 1.0 cm. (B, right) Relative invasion to male WT mice without angiogenic factors (PBS) was determined by fluorescence of cell pellets labeled with FITC-Lectin. *P<0.05, **P<0.01 using Dunn's test following the Kruskal-Wallis test. Bars represent mean values in each group. (C) Bone marrow (BM) transplantation model. Limb survival rate after ischemic surgery in male WT mice receiving male WT BM (WT-BM→WT) or male ARKO BM (KO-BM→WT), and male ARKO mice receiving male WT BM (WT-BM→KO) or male ARKO BM (KO-BM→KO). n=10 in each recipient group. **P<0.01 vs. male ARKO mice receiving the same genotype of BM at day 21 after ischemia using the log-rank test with Bonferroni-corrected pairwise comparisons. (D) Ratio of blood flow in ischemic to nonischemic limb by LSBF at each time point after ischemic surgery in male WT and male ARKO mice with BM transplantation treatment between BM of male WT mice and BM of male ARKO mice. n=10 in each recipient group. **P<0.01 vs. male ARKO mice receiving the same genotype of BM at days 3 to 21 after ischemia using a linear mixed effects regression analysis. Error bars represent SEM.