
Figure 7. Association between AR and VEGF receptor signaling pathway in HUVECs.
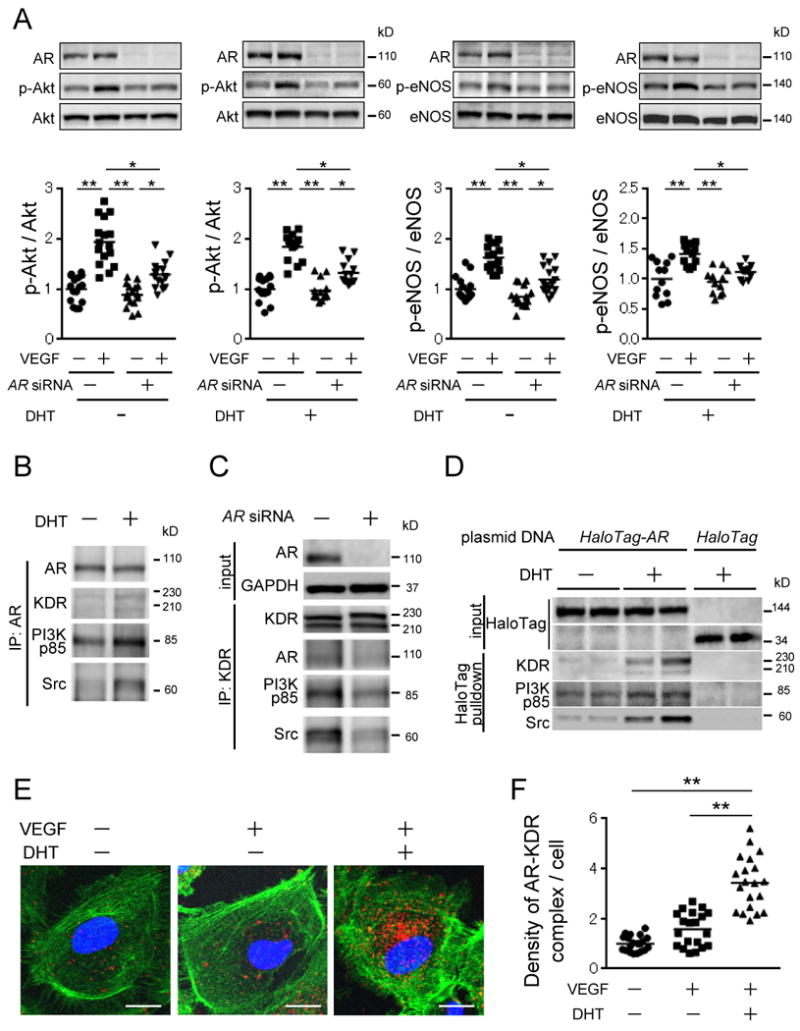
(A) VEGF-stimulated phosphorylation of Akt and eNOS in HUVECs with or without AR knockdown. The value of WT control was set as 1. n=12-16 in each experiment. (B) Immunoprecipitation experiments using AR antibody with or without DHT. (C) Immunoprecipitation experiments using KDR antibody with or without AR knockdown. (D) HaloTag pull-down assay in HUVECs expressing HaloTag-AR fusion protein. (E and F) In site proximity ligation assay using AR and KDR antibodies in HUVECs with or without ligands. (E) Confocal microscopy images indicate endogenous AR-KDR complexes (red dots), nuclear (blue) and filamentous actin (green). Scale bar indicates 20 μm. (F) Quantified results showing fold increase in fluorescent signal density per cell for each condition. Five different visual fields were randomly selected for counting red dots in four independent samples of each group, and the values of control cells (VEGF (-) and DHT (-)) were set at 1.0. **P<0.01 using Dunn's test following the Kruskal-Wallis test. Bars represent mean values in each group.