Figure 1.

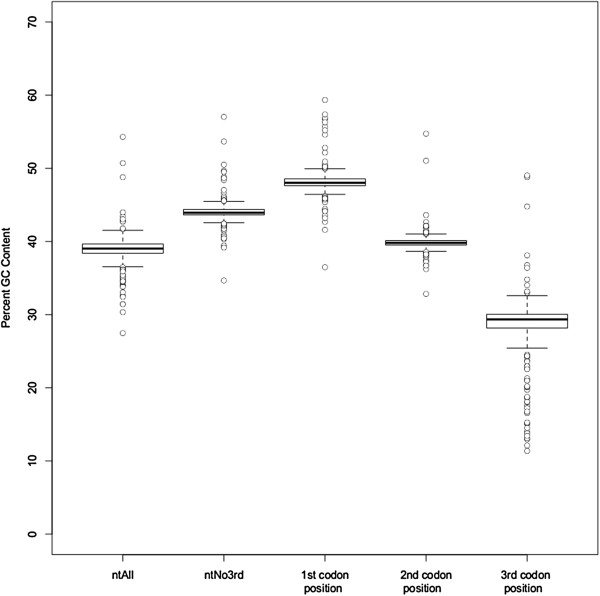
Box plots of percent GC content in the ntAll and ntNo3rd data sets as well as in the first, second, and third codon positions of the ntAll data set.

Box plots of percent GC content in the ntAll and ntNo3rd data sets as well as in the first, second, and third codon positions of the ntAll data set.