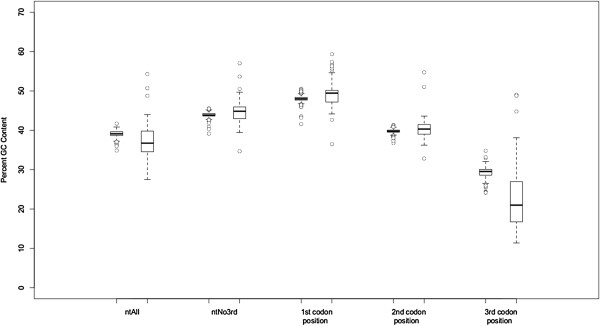
Figure 2.

Box plots of percent GC content in seed plants (Spermatophyta; on left) and the data set as a whole (Viridiplantae; on right) in the ntAll and ntNo3rd data sets as well as the first, second, and third codon positions of the ntAll data set. For each pair of box plots, values for seed plants (Spermatophyta) are on the left, and values for all green plant taxa (Viridiplantae) are on the right.
