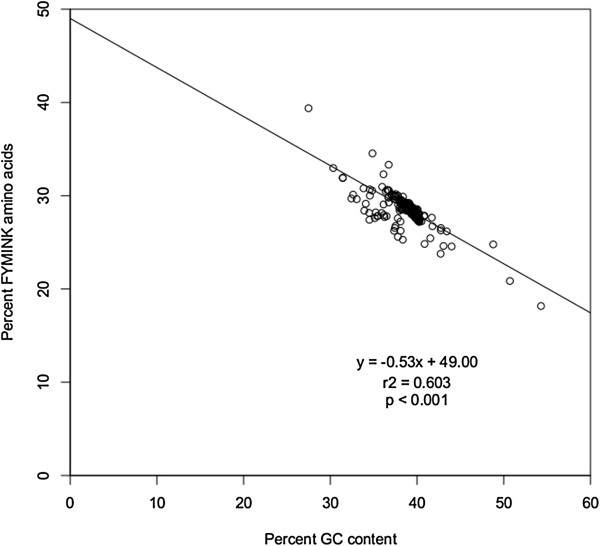
Figure 4.

Correlation between percent GC nucleotide content in the ntAll matrix and percent of amino acids in the AA matrix that are coded for by AT-rich codons (F, Y, M, I, N, and K).

Correlation between percent GC nucleotide content in the ntAll matrix and percent of amino acids in the AA matrix that are coded for by AT-rich codons (F, Y, M, I, N, and K).